Awesome Analysis PowerPoint Template and Google Slides Themes

PowerPoint slide illustrating technology growth percentages in a sleek, monochromatic design with three caption sections.
P.ID : 15149
    149 views
    9 Downloads
    Get Custom Slides by Experts
    Instantly Access Templates in PowerPoint

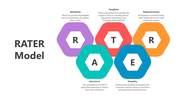
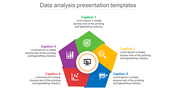
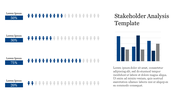
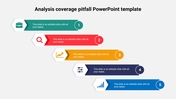
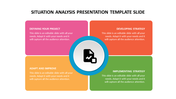
    Analysis Presentation Template And Google Slides Themes


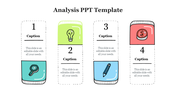
    Need to explain some numbers and what they mean? This analysis PowerPoint template is perfect for you! It has clean white slides with boxes where you can put your data and explain it in simple terms. Each box even has a percentage symbol to show how important the information is.

    This template is great for anyone who wants to share their findings with others, like students, teachers, business people, or even scientists. It's like a cheat sheet for explaining complicated stuff! We know that sometimes numbers and data can be confusing, but this template makes it easy to understand. Plus, it works with Google Slides too! Lots of people wonder how to make their presentations look professional, and this template does all the hard work for you. Download it now!

    Features of the template

    • 100% customizable slides and easy to download.
    • Slides are available in different nodes & colors.
    • The slide contains 16:9 and 4:3 formats.
    • It is easy to change the colors of the slide quickly. 
    • Well-crafted template with an instant download facility.
    Advertisement

    You May Also Like These PowerPoint Templates

    Add to Wishlist
    Download
    AI Customize
    Competitive analysis slides featuring various comparison tables and rating charts for evaluating competitors.
    Add to Wishlist
    Download
    AI Customize
    Slide featuring three overlapping circles in blue, red, and green with key points, alongside a yellow topped text box.
    Add to Wishlist
    Download
    AI Customize
    Five colorful boxes in teal, green, blue, pink, and gray arranged horizontally with icons and captions below arrows.
    Add to Wishlist
    Download
    AI Customize
    Five numbered hexagons in red, orange, green, teal, and blue, each with text inside.
    Add to Wishlist
    Download
    AI Customize
    Risk analysis chart listing potential risks, their likelihood and impact scores, and priority rankings.
    Add to Wishlist
    Download
    AI Customize
    Slide deck showcasing cost effectiveness analysis with a triangular infographic and colorful supporting charts.
    Add to Wishlist
    Download
    AI Customize
    A colorful business forecasting slide featuring a puzzle like layout that outlines key advantages.
    Add to Wishlist
    Download
    AI Customize
    Market analysis template with seven numbered steps arranged around a central magnifying glass icon over a pink background.
    Add to Wishlist
    Download
    AI Customize
    A business analytics PowerPoint slide with icons surrounding a magnifying glass and a book with captions on a dark theme.
    Add to Wishlist
    Download
    AI Customize
    Finance-themed slide with an orange balance scale graphic and donut charts showing different percentages on the left.
    Free
    Add to Wishlist
    Download
    AI Customize
    Three vertical capsule shaped charts in pink, gray, and red on a dark background, with a large orange arrow at the bottom.
    Add to Wishlist
    Download
    AI Customize
    Growth analysis PowerPoint template with four steps and a computer showing bar chart analysis.
    Add to Wishlist
    Download
    AI Customize
    Infographic design featuring a magnifying glass lens divided into four quadrants, each representing a type of analysis.
    Add to Wishlist
    Download
    AI Customize
    Root cause analysis slide with a tree diagram and four labeled colored boxes on branches, with three captions at the bottom.
    Free
    Add to Wishlist
    Download
    AI Customize
    Map-based analysis design with statistical data visuals including circular graphs and demographic distributions.
    Add to Wishlist
    Download
    AI Customize
    Circular infographic with a central globe icon connected to eight color-coded nodes for analytics techniques.
    Free
    Add to Wishlist
    Download
    AI Customize
    Colorful radial design with six segments around a red analysis icon, highlighting key analytics strategies.