Best Data Analytics PPT Template - Orange Theme

A data analytics slide featuring a magnifying glass icon at the center, surrounded by sections for various analytics topics.
P.ID : 25756
    231 views
    12 Downloads
    Get Custom Slides by Experts
    Instantly Access Templates in PowerPoint

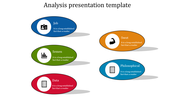
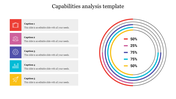
    Data Analytics PPT for Presentation with Orange Theme

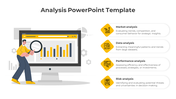
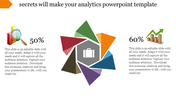
    Did you know that businesses leveraging data analytics are more likely to outperform their competitors? This data analysis PowerPoint slide is your gateway to unlocking that competitive edge and visually narrating the story behind your data. At the heart of this versatile slide lies a lens design—a symbolic focal point connecting your audience with the fineness of data analytics. With six captions with icons, this slide transforms complexity into clarity, making it an invaluable tool for presenting your data analytics ideas and processes. Navigate the data landscape with precision as the icons strategically guide your audience through intricate strategies and insights. This multi-purpose slide ensures your data analytics story is not only heard but also visually comprehended.

    Features of the template

    • 100% customizable slides and easy to download
    • The slides contain 16:9 and 4:3 formats.
    • It is easy to change the slide colors quickly.
    • Well-crafted template with an instant download option.
    • It has a colorful design and captions.
    • Highly compatible with PowerPoint.
    Advertisement

    You May Also Like These PowerPoint Templates

    Add to Wishlist
    Download
    AI Customize
    Data analysis featuring icons for data interpretation, market research, and performance evaluation.
    Free
    Add to Wishlist
    Download
    AI Customize
    Amazing Business Analytics PPT Templates and Google Slides
    Add to Wishlist
    Download
    AI Customize
     slide featuring three circular charts for data analysis, followed by a line chart displaying monthly trends.
    Add to Wishlist
    Download
    AI Customize
    Four blue pin markers with circular bases in a zigzag pattern, each labeled with percentages and descriptive captions.
    Add to Wishlist
    Download
    AI Customize
    Cross layout with four circular icons in gold tones, each linked by dotted lines, and captions listed vertically on right.
    Add to Wishlist
    Download
    AI Customize
    Analysis slide featuring a magnifying glass over banana, with three circular progress charts in green, orange, and yellow.
    Add to Wishlist
    Download
    AI Customize
    Business analytics slide featuring a circular pie chart with percentages representing different business data segments.
    Add to Wishlist
    Download
    AI Customize
    Four staggered colored bars in blue, green, yellow, and purple with icons and captions aligned horizontally.
    Add to Wishlist
    Download
    AI Customize
    Stakeholder analysis slide showing a group of professionals discussing laptops in a meeting room.
    Add to Wishlist
    Download
    AI Customize
    Central speedometer icon with curved black line and five connected colored circles linking labeled sections.
    Add to Wishlist
    Download
    AI Customize
    Three segmented semi circular diagram in blue tones with icons, and a black magnifying glass overlaying a head symbol.
    Free
    Add to Wishlist
    Download
    AI Customize
    Vertical bar chart with five captions and a magnifying glass highlighting one, and numbered list with text on the right.
    Free
    Add to Wishlist
    Download
    AI Customize
    Business slide with two numbered green markers, a magnifying glass over coins, and a group of people analyzing a chart.
    Free
    Add to Wishlist
    Download
    AI Customize
    Business analytics template with five green panels, each showing icons for different analytics concepts.
    Add to Wishlist
    Download
    AI Customize
    Slide featuring four circular progress charts in yellow, pink, blue, and green, with captions on a gray background.