Free - Amazing Business Analytics PPT Templates and Google Slides

Free
Amazing Business Analytics PPT Templates and Google Slides
P.ID : 37410
    11 slides
    Slide deck with colorful layouts around a central icon, highlighting various aspects of social impact assessment.
    13 slides
    Data analysis slides with flowcharts, icons, and colored segments for statistical methods and machine learning algorithms.
    11 slides
    Collection of slides showing different styles like diamonds, hexagons, and flowcharts, with ethical principles.
    11 slides
    Slide pack showing a cost benefit analysis with a scale balancing costs and benefits, using colorful charts and diagrams.
    422 views
    190 Downloads
    Get Custom Slides by Experts
    Instantly Access Templates in PowerPoint

    Business Analytics Templates and Google Slides

    Do you want to discover an incredible collection of Business Analytics PowerPoint Templates! These templates are like special glasses that help you see and understand important information about a business easily.
    Imagine you have a secret code that can unlock the secrets of a business's success. That's what business analytics is all about! It's like being a detective, gathering clues and analyzing data to make smart decisions. Our templates allow you to present complex concepts simply and engagingly.
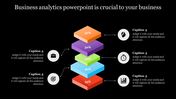
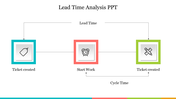
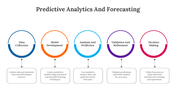
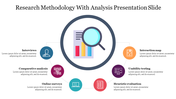
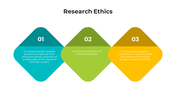
    Using our templates, you can visualize data, such as sales trends, customer behavior, or market insights, through colorful charts, graphs, and diagrams. It's like creating a puzzle that tells a story about the business.
    Get ready to unravel the mysteries of business with our accessible and visually appealing Business Analytics PowerPoint Templates. Start exploring the world of data-driven decisions today!

    Features of the template 

    • 100% customizable slides and easy to download. 
    • Slides are available in different nodes & colors. 
    • The slide contains 16:9 and 4:3 formats. 
    • Easy to change the colors of the slides quickly. 
    • Well-crafted template with an instant download facility. 
    • Highly compatible with PowerPoint and Google Slides. 
    Advertisement

    You May Also Like These PowerPoint Templates

    Add to Wishlist
    Download
    AI Customize
    Business Impact Analysis slide featuring a risk assessment table with color coded levels from low to very high.
    Add to Wishlist
    Download
    AI Customize
    Best Customer Analysis Sample For Presentation Template
    Add to Wishlist
    Download
    AI Customize
    5C analysis slide deck with various colorful layouts explaining the company, customers, competitors, collaborators, context.
    Add to Wishlist
    Download
    AI Customize
    The data analysis slide has large text, a variety of icons above a person's silhouette, and color options at the bottom.
    Add to Wishlist
    Download
    AI Customize
    Colorful graphic showcasing a situation analysis framework with six labeled sections around a central analysis icon.
    Add to Wishlist
    Download
    AI Customize
    Slide deck outlining the change readiness assessment process, with four color coded phases and corresponding steps.
    Add to Wishlist
    Download
    AI Customize
    Editable Company Analysis PowerPoint And Google Slides
    Add to Wishlist
    Download
    AI Customize
    Financial analysis slide with pie charts showing percentages and descriptive text for each section.
    Add to Wishlist
    Download
    AI Customize
    PowerPoint slide for Pareto analysis with two circular diagrams showing reasons and complaints in percentages.
    Add to Wishlist
    Download
    AI Customize
    Content Analysis PowerPoint And Google Slides Themes
    Add to Wishlist
    Download
    AI Customize
    Organizational assessment slide deck highlighting mission at the center, surrounded by four elements with level indicators.
    Add to Wishlist
    Download
    AI Customize
    Category analysis slide featuring six colored boxes each with bullet points.
    Add to Wishlist
    Download
    AI Customize
    Customer analytics slide deck with five diamond icons representing steps from customer experience to data collection.
    Add to Wishlist
    Download
    AI Customize
    Slide with two columns in red and blue, each with three rectangular boxes, connected to a central circular icon.
    Add to Wishlist
    Download
    AI Customize
    Two figures connected by curved orange arrows leading to two segmented groups of people in blue and gray.
    Add to Wishlist
    Download
    AI Customize
    Semi circular infographic in red, orange, yellow, and blue segments displaying performance factors with details.
    Add to Wishlist
    Download
    AI Customize
    Slide with a central book icon surrounded by four diamonds in yellow, red, green, and purple, each with icon and text area.