Stunning Business Impact Analysis Plan Presentation Slide
Nodes
Colors

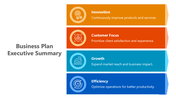


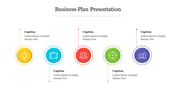
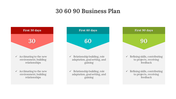

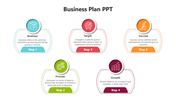

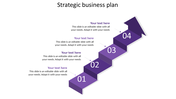
Three Nodded Circle Business Impact Analysis Plan Template Slide
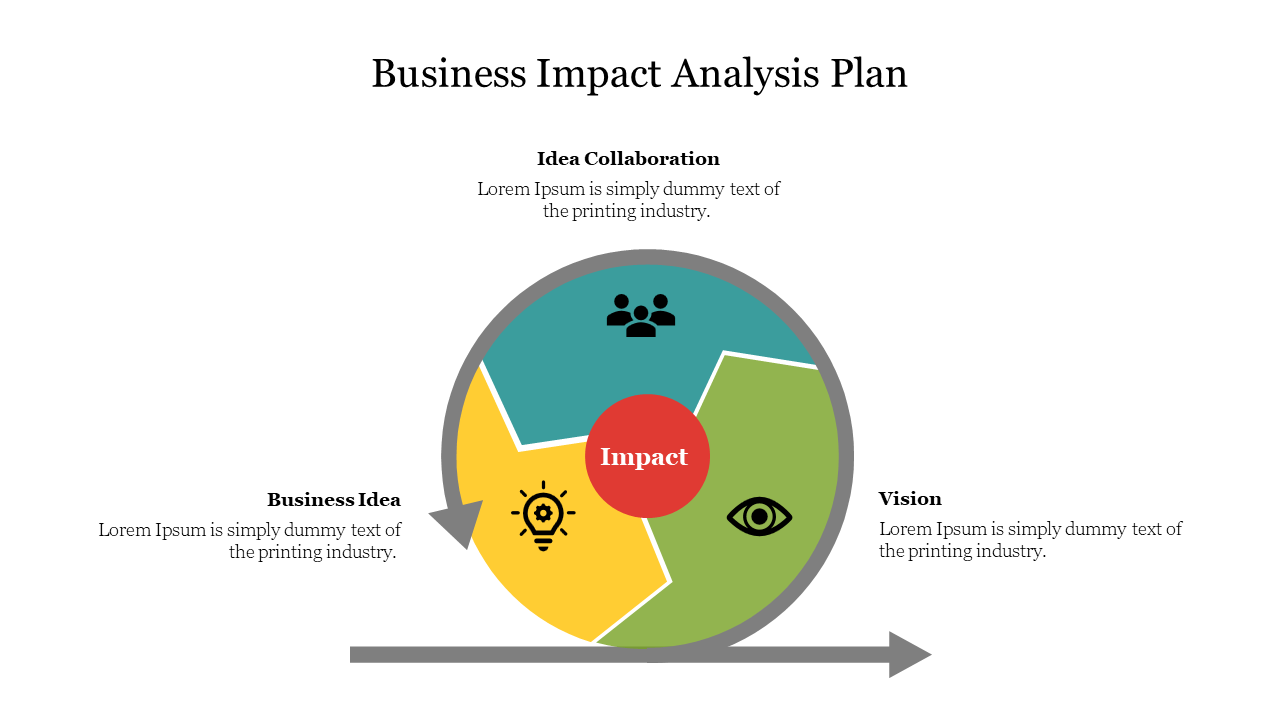
Getting this business impact analysis plan determines the business activities and the associated requirements to ensure during and after the business disruption. Try this slide which helps to predict the consequences to the business process.
About the template:
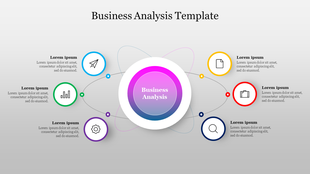
Grab this business impact analysis plan with a white background that highlights the texts and images; it makes the template look brighter. And the slide contains the animated circle with the two arrows circulated around and with the three different colors with icons and headings of the business analysis. It also contains the dummy texts for you to edit and add information related to the slide. Customize the slide with various features provided by SlideEgg.
Download this template to present the prediction of the consequences to get resolved to your audience. Try out our other slides of business intelligence ERP template from SlideEgg.
Features of the slide:
1.100% customizable slides and easy to download.
2. Slides available in different nodes & colors.
3. The slides contained 16:9 and 4:3 formats.
4. Easy to change the slide colors quickly.
5. Well-crafted template with instant download facility.
6. The creative circle-shaped PowerPoint presentation.
Explore Related Collections
Recommended based on this template.










You May Also Like These PowerPoint Templates



Showing20 of69,218 templates