Best Social Impact Assessment PowerPoint And Google Slides

Pack of 11 slides
P.ID : 71733
Advertisement
510 views
64 Downloads
Get Custom Slides by Experts
Instantly Access Templates in PowerPoint

Social Impact Assessment Presentation Slides


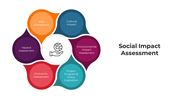
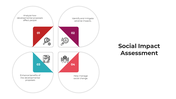
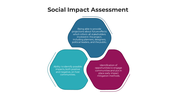
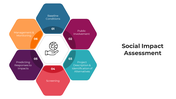
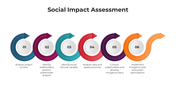
In today's interconnected world, understanding the broader implications of decisions is pivotal. "Social Impact Assessment" is a vital tool, analyzing a project's potential effects on communities. It transcends financial evaluations, spotlighting the societal consequences and ensuring sustainable, responsible development. This approach not only identifies and mitigates potential negatives but fosters decisions beneficial for both entities and communities. Tailored for professionals like urban planners and NGOs, the template simplifies this complex assessment. Its editable slides cover everything from impact identification to mitigation strategies, providing a comprehensive overview. Presenters can seamlessly elucidate the importance of assessing social implications, guiding attendees towards responsible decision-making. With its clear design and structure, this tool is a must-have for those committed to community-conscious development.


Features of the templates:


  • 100% customizable slides and easy to download.
  • Slides are available in different nodes & colors.
  • The slide contained 16:9 and 4:3 formats.
  • Easy to change the slide colors quickly.
  • It is a well-crafted template with an instant download facility.
  • Highly compatible with PowerPoint and Google Slides.

You May Also Like These PowerPoint Templates

Add to Wishlist
Download
AI Customize
Four vertical colored panels in purple, blue, green, and red, each with circular icons and financial analysis topics.
Free
Add to Wishlist
Download
AI Customize
Analysis presentation template with six sections arranged in a blue circle, each featuring an icon and caption.
Add to Wishlist
Download
AI Customize
Modern infographic slide design showcasing three steps for analysis, each with a corresponding icon.
Add to Wishlist
Download
AI Customize
Gantt chart template for January 2019, featuring rows of tasks and columns for Week 1 to Week 3 with colored activity bars.
Free
Add to Wishlist
Download
AI Customize
Purple themed three step analysis infographic with numbered arrows and icons for each stage.
Free
Add to Wishlist
Download
AI Customize
Effective Business Analytics PowerPoint Template-Five Node
Free
Add to Wishlist
Download
AI Customize
Analysis PPT Templates that are Unique and Creative
Add to Wishlist
Download
AI Customize
Analysis PowerPoint template featuring four segments with icons and descriptions of various types.
Free
Add to Wishlist
Download
AI Customize
GROW model colorful diagram PPT slides showing the stages with corresponding questions for each stage with layout design.
Free
Add to Wishlist
Download
AI Customize
Blue themed analysis slide featuring a 75 percent pie chart and six captioned icons for data driven presentations.
Add to Wishlist
Download
AI Customize
Analytics tactics slide with four numbered captions in orange, red, blue, and green, each paired with relevant icons.
Free
Add to Wishlist
Download
AI Customize
Silhouette of a businessman at the center, connected to six colorful caption boxes with numbered steps on both sides.
Free
Add to Wishlist
Download
AI Customize
Slide illustrating an analysis process with four colored blocks in different stages each with percentage values and captions.
Add to Wishlist
Download
AI Customize
Purple analytics PowerPoint template with sequentially numbered arrows, each with a different icon for key business metrics.
Free
Add to Wishlist
Download
AI Customize
Engineer-focused slide with a figure in a yellow hard hat, flanked by green arrows denoting processes.
Free
Add to Wishlist
Download
AI Customize
Timeline template showing a journey from 2016 to 2020 with icons for research, finance, analytics, intelligence, and success.
Add to Wishlist
Download
AI Customize
Social media icons with placeholder text and four colorful data icons on the right.
Add to Wishlist
Download
AI Customize
Results template showing research and analysis steps, with visual data on men and women in a company showings their earnings.
Add to Wishlist
Download
AI Customize
Business analysis bar chart slide with six colored bars representing different activities and percentages with text area.
Add to Wishlist
Download
AI Customize
A pack of slides with a colorful SCQA framework illustrating icons with visual charts and layouts.
Add to Wishlist
Download
AI Customize
The thematic analysis slide diagram shows the process from qualitative data to codes and themes in three colors.
Add to Wishlist
Download
AI Customize
Analysis PowerPoint Presentation And Google Slides Themes
Add to Wishlist
Download
AI Customize
Dupont analysis overview slides illustrating the calculation of profit margin with different layout designs with icons.
Add to Wishlist
Download
AI Customize
Current state analysis slide comparing cost reduction and value creation strategies with two colored boxes and text caption.
Add to Wishlist
Download
AI Customize
An infographic showing three stages of a research paradigm in red, orange and green in hexagon shape each with icons.
Add to Wishlist
Download
AI Customize
A reflective learning process slide shows four stages each in colorful boxes with text descriptions.
Add to Wishlist
Download
AI Customize
Grid of various plot diagram slides showcasing narrative arcs, with labels for different stages of a plot's progression.