Usable Cost Effectiveness Analysis PPT And Google Slides

Pack of 11 slides
P.ID : 72427
Advertisement
116 views
24 Downloads
Get Custom Slides by Experts
Instantly Access Templates in PowerPoint

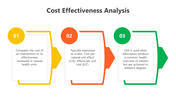
Cost Effectiveness Analysis Presentation Slides


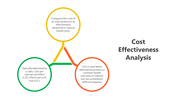
Empower your financial decision-making with our comprehensive cost effectiveness analysis PPT and Google Slides templates. Tailored for professionals, analysts, and educators in finance, economics, and business, these templates are invaluable tools for conducting thorough cost-benefit analyses and optimizing resource allocation. Each slide is meticulously designed to present complex financial concepts in a clear, concise, and visually engaging manner, making it easy for presenters to convey their analyses effectively.

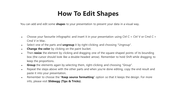
What sets our templates apart is their 100% editable and customizable features, allowing you to tailor every aspect of your presentation to suit your specific needs and preferences. Whether you're presenting to stakeholders, teaching a course, or conducting research, our templates provide the flexibility and versatility to meet your objectives.

Elevate your cost-effectiveness analysis today by downloading our expertly crafted templates. Seize the opportunity to make informed financial decisions, maximize efficiency, and drive organizational success. Don't miss out on this chance to optimize your analyses - download this presentation today!

Features of this templates


  • 100% customizable slides and easy to download.
  • The slide contains 16:9 and 4:3 formats.
  • Easy to change the colors of the slide quickly.
  • Highly compatible with PowerPoint and Google Slides.

You May Also Like These PowerPoint Templates

Add to Wishlist
Download
AI Customize
Data analysis slide with a monitor showing analytics icons, and five colorful speech bubbles indicating various steps around it.
Add to Wishlist
Download
AI Customize
Slide with a blue sidebar featuring a document icon, two captions in yellow and orange circles, and text at bottom.
Add to Wishlist
Download
AI Customize
Analysis slide featuring a magnifying glass over banana, with three circular progress charts in green, orange, and yellow.
Add to Wishlist
Download
AI Customize
Four staggered colored bars in blue, green, yellow, and purple with icons and captions aligned horizontally.
Add to Wishlist
Download
AI Customize
Stakeholder analysis slide showing a group of professionals discussing laptops in a meeting room.
Add to Wishlist
Download
AI Customize
Central speedometer icon with curved black line and five connected colored circles linking labeled sections.
Add to Wishlist
Download
AI Customize
Four hexagons in red, blue, yellow, and green, each with a relevant financial icon and captions around it.
Add to Wishlist
Download
AI Customize
Three segmented semi circular diagram in blue tones with icons, and a black magnifying glass overlaying a head symbol.
Free
Add to Wishlist
Download
AI Customize
Vertical bar chart with five captions and a magnifying glass highlighting one, and numbered list with text on the right.
Free
Add to Wishlist
Download
AI Customize
Business slide with two numbered green markers, a magnifying glass over coins, and a group of people analyzing a chart.
Add to Wishlist
Download
AI Customize
Pricing table layout with three columns labeled with subscription, in a red and white color scheme.
Add to Wishlist
Download
AI Customize
Slide featuring four circular progress charts in yellow, pink, blue, and green, with captions on a gray background.
Add to Wishlist
Download
AI Customize
Analysis PowerPoint template featuring four colorful stages from data interpretation to risk Assessment with icons.
Add to Wishlist
Download
AI Customize
Three head silhouettes in blue and gray with icons, connected by arrows with captions below, on a white background.
Add to Wishlist
Download
AI Customize
Analysis PowerPoint template displaying a blue circular diagram with steps from interviewing stakeholders to building BPMN.
Add to Wishlist
Download
AI Customize
Analysis report template featuring a purple and green area graph comparing five projects, with separate information
Add to Wishlist
Download
AI Customize
Six oval elements in gray with icons and labels for analysis categories placed in white backdrop.
Add to Wishlist
Download
AI Customize
Modern design featuring a circular orange arc in the center, flanked by six numbered steps on curved paths on both sides.
Add to Wishlist
Download
AI Customize
Three vertical blocks in yellow, blue, and green, each with numbers and business analytics icons on a light background.
Add to Wishlist
Download
AI Customize
A pack of DESC model slides with four elements in various colorful layout designs with text descriptions.
Add to Wishlist
Download
AI Customize
Circular flowchart with colored arrows in blue, purple, orange, and yellow, pointing to icons and text areas beneath.
Add to Wishlist
Download
AI Customize
A PowerPoint slide featuring a magnifying glass focusing on data analysis with icons representing various analytics metrics.
Add to Wishlist
Download
AI Customize
Four step layout with colored tabs in orange, blue, green, and purple, featuring icons and white text boxes.
Add to Wishlist
Download
AI Customize
A strategic analysis format diagram with a triangle structure representing political, economic, and technological factors.
Add to Wishlist
Download
AI Customize
Capability Gap PowerPoint And Google Slides Template
Add to Wishlist
Download
AI Customize
Structured analytics template with blue visuals and pentagonal icons illustrating three data tracking elements.
Add to Wishlist
Download
AI Customize
Professional PowerPoint slide showing a situation analysis diagram with color coded icons for different business processes.
Add to Wishlist
Download
AI Customize
The best break even analysis ppt template model
Add to Wishlist
Download
AI Customize
Analytics PPT slide showing web analytics uses from traffic source analysis to conversion optimization with icons.