3C Analysis Design PowerPoint And Google Slides Themes

Pack of 13 slides
P.ID : 53792
Advertisement
1.1K+ views
144 Downloads
Get Custom Slides by Experts
Instantly Access Templates in PowerPoint

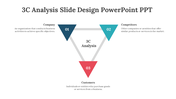
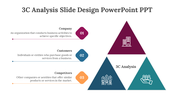
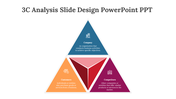
3C Analysis Presentation Slide

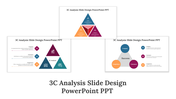
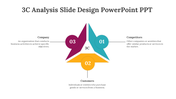
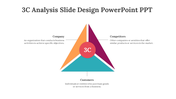
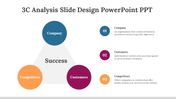
The 3C analysis is a strategic framework used to assess a company's internal and external environment. It evaluates three key factors: Company, Customers, and Competitors. By examining these elements, organizations gain insights into their strengths, weaknesses, opportunities, and threats. The analysis enables businesses to identify competitive advantages, understand customer needs and preferences, and benchmark against industry rivals. Utilizing the 3C analysis template provides a structured approach to gather and analyze relevant data, informing strategic decision-making and helping companies stay ahead in a dynamic marketplace.

Features of the templates:

  • 100% customizable slides and easy to download.
  • Slides are available in different nodes & colors.
  • The slide contains 16:9 and 4:3 formats.
  • Easy to change the colors of the slide quickly.
  • Highly compatible with PowerPoint and Google Slides.
  • Well-crafted template with an instant download facility.

You May Also Like These PowerPoint Templates

Add to Wishlist
Download
AI Customize
Illustration of a woman analyzing colorful bar and pie charts, with three color coded circular icons on the right.
Add to Wishlist
Download
AI Customize
Five numbered interconnected puzzle pieces in red, green, purple, teal, and blue, with human illustrations above.
Add to Wishlist
Download
AI Customize
Analysis template with a man looking through a magnifying glass at a computer screen with four types and caption areas.
Add to Wishlist
Download
AI Customize
Step-by-step analysis diagram with a central focus on analysis, flanked by six green-highlighted steps.
Add to Wishlist
Download
AI Customize
Molecular-style infographic with interconnected colored nodes linked to six labeled captions for analysis ideas.
Add to Wishlist
Download
AI Customize
Central hexagonal shape with multicolor triangles around and two text areas with bar chart and coin stack with percentages.
Add to Wishlist
Download
AI Customize
Business Analytics slide featuring three stages with icons representing question, insight, and growth.
Add to Wishlist
Download
AI Customize
Four circular progress charts in yellow, blue, orange, and pink above text boxes, showcasing percentage values.
Add to Wishlist
Download
AI Customize
Illustration of a person analyzing charts in blue accents, with four analysis types listed on the right.
Add to Wishlist
Download
AI Customize
Four colorful vertical banners in yellow, red, blue, and green with icons, title, and descriptions for web analytics uses.
Add to Wishlist
Download
AI Customize
Data analysis featuring icons for data interpretation, market research, and performance evaluation.
Free
Add to Wishlist
Download
AI Customize
Amazing Business Analytics PPT Templates and Google Slides
Add to Wishlist
Download
AI Customize
 slide featuring three circular charts for data analysis, followed by a line chart displaying monthly trends.
Add to Wishlist
Download
AI Customize
Slide with a blue sidebar featuring a document icon, two captions in yellow and orange circles, and text at bottom.
Add to Wishlist
Download
AI Customize
Four blue pin markers with circular bases in a zigzag pattern, each labeled with percentages and descriptive captions.
Add to Wishlist
Download
AI Customize
Cross layout with four circular icons in gold tones, each linked by dotted lines, and captions listed vertically on right.
Add to Wishlist
Download
AI Customize
Slide with an orange upright and a purple inverted triangle, each featuring icons and four numbered captions around them.
Add to Wishlist
Download
AI Customize
Analysis slide featuring a magnifying glass over banana, with three circular progress charts in green, orange, and yellow.
Add to Wishlist
Download
AI Customize
Business analytics slide featuring a circular pie chart with percentages representing different business data segments.
Add to Wishlist
Download
AI Customize
Four staggered colored bars in blue, green, yellow, and purple with icons and captions aligned horizontally.
Add to Wishlist
Download
AI Customize
Stakeholder analysis slide showing a group of professionals discussing laptops in a meeting room.
Add to Wishlist
Download
AI Customize
Central speedometer icon with curved black line and five connected colored circles linking labeled sections.
Add to Wishlist
Download
AI Customize
Four hexagons in red, blue, yellow, and green, each with a relevant financial icon and captions around it.
Add to Wishlist
Download
AI Customize
Three segmented semi circular diagram in blue tones with icons, and a black magnifying glass overlaying a head symbol.
Free
Add to Wishlist
Download
AI Customize
Vertical bar chart with five captions and a magnifying glass highlighting one, and numbered list with text on the right.
Free
Add to Wishlist
Download
AI Customize
Business slide with two numbered green markers, a magnifying glass over coins, and a group of people analyzing a chart.
Add to Wishlist
Download
AI Customize
Pricing table layout with three columns labeled with subscription, in a red and white color scheme.
Free
Add to Wishlist
Download
AI Customize
Business analytics template with five green panels, each showing icons for different analytics concepts.
Add to Wishlist
Download
AI Customize
Slide featuring four circular progress charts in yellow, pink, blue, and green, with captions on a gray background.
Add to Wishlist
Download
AI Customize
Analysis PowerPoint template featuring four colorful stages from data interpretation to risk Assessment with icons.
Add to Wishlist
Download
AI Customize
Three head silhouettes in blue and gray with icons, connected by arrows with captions below, on a white background.