Elegant DuPont Analysis PPT And Google Slides Theme

Pack of 11 slides
P.ID : 71776
Advertisement
527 views
81 Downloads
Get Custom Slides by Experts
Instantly Access Templates in PowerPoint

DuPont Analysis Presentation Slides


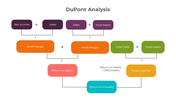
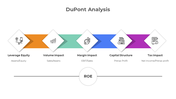
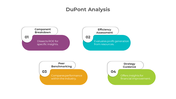
Delving into DuPont Analysis opens a window into a company's financial performance, dissecting Return on Equity (ROE) into profit margin, asset turnover, and leverage. This method aids in evaluating management's effectiveness in asset utilization and profit generation. Employing DuPont Analysis provides a nuanced understanding of a company's financial health, guiding strategic decisions and investment assessments. Tailored for change leaders, managers, and professionals, the Change Management PowerPoint template proves invaluable for orchestrating successful organizational transitions. It offers a structured framework for articulating change strategies, engaging stakeholders, and tracking progress. Featuring a user-friendly interface and fully editable slides covering key aspects of Change Management, this template integrates seamlessly with any presentation style or brand guidelines, empowering presenters to navigate organizational transitions with confidence. By utilizing this template, presenters save time and ensure a polished, professional presentation, ultimately leading to successful change initiatives. Equip your team with the resources they need to drive successful change initiatives, ultimately leading to a future of growth and adaptability.

Features of the templates:


  • 100% customizable slides and easy to download.
  • Slides are available in different nodes & colors.
  • The slide contained 16:9 and 4:3 formats.
  • Easy to change the slide colors quickly.
  • It is a well-crafted template with an instant download facility.

You May Also Like These PowerPoint Templates

Add to Wishlist
Download
AI Customize
Slide with five numbered colorful arrows with text area on the left, and a pie chart highlighting observation
Add to Wishlist
Download
AI Customize
A structured 8D analysis slide featuring eight distinct steps, each labeled with a numbered blue bar.
Add to Wishlist
Download
AI Customize
Business Impact Analysis slide featuring a risk assessment table with color coded levels from low to very high.
Add to Wishlist
Download
AI Customize
5C analysis slide deck with various colorful layouts explaining the company, customers, competitors, collaborators, context.
Add to Wishlist
Download
AI Customize
Business plan market analysis slide featuring an orange semi circular chart with numbers and placeholder text.
Add to Wishlist
Download
AI Customize
Colorful graphic showcasing a situation analysis framework with six labeled sections around a central analysis icon.
Add to Wishlist
Download
AI Customize
Colorful circular diagram slide illustrating a situation analysis framework with captions for four categories with icons.
Add to Wishlist
Download
AI Customize
Slide deck outlining the change readiness assessment process, with four color coded phases and corresponding steps.
Add to Wishlist
Download
AI Customize
Editable Company Analysis PowerPoint And Google Slides
Add to Wishlist
Download
AI Customize
Illustration of a break even analysis with a balanced scale, showing percentages in circular shapes on either side.
Free
Add to Wishlist
Download
AI Customize
Innovate Business Analysis PPT And Google Slides Template
Add to Wishlist
Download
AI Customize
PowerPoint slide for Pareto analysis with two circular diagrams showing reasons and complaints in percentages.
Add to Wishlist
Download
AI Customize
Content Analysis PowerPoint And Google Slides Themes
Add to Wishlist
Download
AI Customize
Organizational assessment slide deck highlighting mission at the center, surrounded by four elements with level indicators.
Add to Wishlist
Download
AI Customize
Category analysis slide featuring six colored boxes each with bullet points.
Add to Wishlist
Download
AI Customize
Customer analytics slide deck with five diamond icons representing steps from customer experience to data collection.
Add to Wishlist
Download
AI Customize
Slide with two columns in red and blue, each with three rectangular boxes, connected to a central circular icon.
Add to Wishlist
Download
AI Customize
Business analytics slide displaying a world map with six marked markets and a line chart for monthly data analysis.
Add to Wishlist
Download
AI Customize
Two figures connected by curved orange arrows leading to two segmented groups of people in blue and gray.
Free
Add to Wishlist
Download
AI Customize
A business analytics PowerPoint slide featuring four sections, each with icons and placeholder text.
Add to Wishlist
Download
AI Customize
Semi circular infographic in red, orange, yellow, and blue segments displaying performance factors with details.
Add to Wishlist
Download
AI Customize
Slide with a central book icon surrounded by four diamonds in yellow, red, green, and purple, each with icon and text area.
Add to Wishlist
Download
AI Customize
Core competencies analysis table with numbered steps and corresponding actions for identifying and developing competencies.
Add to Wishlist
Download
AI Customize
Investigative journalism template featuring a magnifying glass on a laptop keyboard, with placeholder text areas.
Add to Wishlist
Download
AI Customize
Analytics slide showcasing industrial buildings and two progress bars highlighting techniques with corresponding percentages.
Add to Wishlist
Download
AI Customize
Four blue and white sections for web analytics uses, featuring icons and text placeholders.
Add to Wishlist
Download
AI Customize
Project prioritization using the Moscow technique, with four sections with placeholder text.
Add to Wishlist
Download
AI Customize
Color-coded break-even analysis with bars from 10M to 30M along a rising dotted line and text areas for values.
Add to Wishlist
Download
AI Customize
Business analysis layout with three numbered hexagon steps and a photo of a business meeting on a dark blue background.
Add to Wishlist
Download
AI Customize
Slide deck outlining the performance evaluation process, with icons and hexagonal shapes depicting key steps.
Add to Wishlist
Download
AI Customize
Financial analysis chart displaying production and sales growth from 2016 to 2019 on a red toned background.