Exploratory Data Analysis PowerPoint And Google Slides

Pack of 17 slides
P.ID : 77480
Advertisement
1 views
1 Downloads
Get Custom Slides by Experts
Enhance Your Presentations with Add-ins
Google Slides Add-in
Access templates directly in Google Slides
Microsoft PowerPoint Add-in
Access templates directly in PowerPoint
GPT Add-on
AI-powered presentation assistance

Exploratory Data Analysis PowerPoint, Google Slides, and Canva Template


Simplify complex datasets and uncover meaningful insights with this Exploratory Data Analysis presentation template. Designed with a modern dark-blue layout and fully editable slides, this template helps you present data exploration techniques, statistical analysis, visualization methods, and business insights in a clear, professional, and visually engaging way. Whether you are preparing analytics reports, research presentations, business reviews, academic projects, or data science workshops, every slide is crafted to transform raw data into understandable and actionable information.

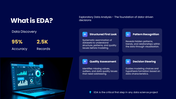
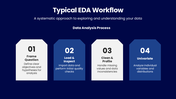
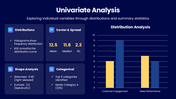
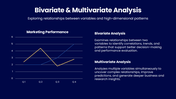
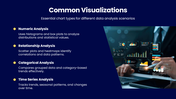
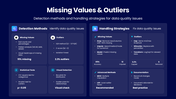
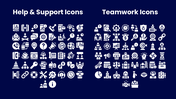
This template includes well-structured slides covering key topics such as introduction to exploratory data analysis (EDA), EDA workflow, univariate analysis, bivariate and multivariate analysis, data visualization methods, missing values and outliers, statistical summaries, pattern identification, and best practices checklist. With clean layouts, charts, graphs, dashboards, timelines, and infographic elements, you can explain analytical concepts clearly while keeping your audience engaged throughout the presentation.


Perfect for data analysts, business analysts, researchers, students, educators, data scientists, marketing professionals, and corporate teams, this template supports better decision-making through data-driven insights. It helps organizations identify trends, detect anomalies, improve data quality, understand customer behavior, and build stronger analytical strategies for business growth.


Fully compatible with PowerPoint, Google Slides, and Canva, this template allows you to easily customize text, charts, graphs, icons, colors, and branding elements without any design experience.
The slides are fully editable and optimized for dashboards, business meetings, research discussions, training sessions, webinars, and educational presentations.


Present data insights with clarity and confidence. Download this Exploratory Data Analysis template today and create professional, engaging, and easy-to-understand presentations in minutes.


Features of this template

  • 100% customizable slides and easy to download.
  • The slides contain 16:9 and 4:3 formats.
  • Easy to change the colors quickly.
  • Highly compatible with PowerPoint, Google Slides, and Canva templates.

You May Also Like These PowerPoint Templates

Add to Wishlist
Download
AI Customize
A 3D smartphone graphic showing data lines and charts, with white text on the left, set against a blue backdrop.
Add to Wishlist
Download
AI Customize
Data analysis slide with a monitor showing analytics icons, and five colorful speech bubbles indicating various steps around it.
Add to Wishlist
Download
AI Customize
Informative slides about data science, highlighting colorful different layout designs and icons.
Add to Wishlist
Download
AI Customize
Big data analytics slide deck with colorful charts, showcasing types, benefits, and decision making aids.
Add to Wishlist
Download
AI Customize
Three colored rectangles in orange, green, and teal, representing types of data stewards with text areas below.
Add to Wishlist
Download
AI Customize
Collection of data analytics icons, including charts, browser windows, magnifying glasses, and statistical graphs.
Add to Wishlist
Download
AI Customize
Data science benefits visualized in a four step process with numbered colorful tabs in pink, green, orange, and blue.
Add to Wishlist
Download
AI Customize
Applications of Data Science in retail marketing, including recommendation systems to inventory management with text.
Free
Add to Wishlist
Download
AI Customize
Data science responsibilities infographic with five U shaped blocks numbered from data collection to data storytelling.
Add to Wishlist
Download
AI Customize
Business data analysis graphic with target and arrows in center, surrounded by six colored captions with icons on both sides.
Add to Wishlist
Download
AI Customize
Illustration of a person interacting with blue data visualization panels, with three numbered text sections on the right.
Add to Wishlist
Download
AI Customize
Add to Wishlist
Download
AI Customize
Pack of slide showcasing data collection methods with icons in different colors on a white backdrop.
Add to Wishlist
Download
AI Customize
Colorful data analysis PowerPoint slide with three groups of progress bars showing percentages for each section.
Add to Wishlist
Download
AI Customize
Data analytics slide showing month wise vertical bars in varied colors, with July emphasized as top performing.
Add to Wishlist
Download
AI Customize
Five colored diamond shapes representing data cleansing strategies, such as automated validation and error detection.