Business Data Analysis PPT Template Download Google Slides

Business data analysis slide with a 3D illustration of data charts and graphs on a computer screen on a blue backdrop.
P.ID : 56420
    11 slides
    Pack of slide showcasing data collection methods with icons in different colors on a white backdrop.
    18 slides
    Editable Data Mining Essentials PPT And Google Slides
    13 slides
    A pack of qualitative research method slides showcasing various colorful layout designs and icons.
    11 slides
    Slide pack showing vibrant segments with colorful process diagrams, representing elements of mixed methods research.
    780 views
    119 Downloads
    Get Custom Slides by Experts
    Instantly Access Templates in PowerPoint

    Engaging Data Analysis PowerPoint PPT Template

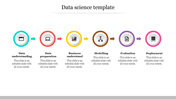
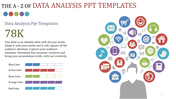
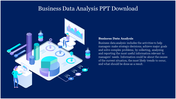
    Download our Business Data Analysis PPT to help users explain techniques and procedures to examine past and current business data. However, You will also learn analytics PowerPoint tips while using this template. The PPT showcases your Analysis report in a data company meeting. In addition, we provide a home setup animation and a text area in this slide to give a clean look and feel. These animations add meaning to an overall Big data Analysis PowerPoint while creating a visually stunning slide. Our templates are 100% customizable and editable.
     

    Features of this template

    • It is a pre-built Slide to save time. 
    • 100% Customizable (shape color, size & text)
    • This template has a blue theme.
    • Drag and drop image placeholder
    • Huge Collections of the data slides to impress your audience
    • This slide supports the 4:3 and 16:9 formats
    Advertisement

    You May Also Like These PowerPoint Templates

    Add to Wishlist
    Download
    AI Customize
    A data science slide with four colorful arrows labeled, from one to four each containing text and small descriptive icons.
    Add to Wishlist
    Download
    AI Customize
    Data classification slide with a central circular diagram divided into four segments, each connected to a text box.
    Add to Wishlist
    Download
    AI Customize
    Slide comparing the roles of Data Scientists and Data Engineers, detailing their responsibilities and programming languages.
    Add to Wishlist
    Download
    AI Customize
    Awesome Data Cleansing Structure PPT And Google Slides
    Add to Wishlist
    Download
    AI Customize
    Slide showing a metrics table on the left and a bar chart with orange and white bars on a blue gradient background.
    Add to Wishlist
    Download
    AI Customize
    Circular diagram with six colored segments around a central circle, illustrating the steps of data analysis.
    Free
    Add to Wishlist
    Download
    AI Customize
    Five step data cleansing process, featuring stages represented with colorful icons.
    Add to Wishlist
    Download
    AI Customize
    Slide featuring data science, data mining, and data analysis steps with placeholder text.
    Add to Wishlist
    Download
    AI Customize
    3D data visualization with charts on a tablet and two hexagonal stats, displayed on a dark blue background.
    Add to Wishlist
    Download
    AI Customize
    Visual representation of business benefits from data science, including improved efficiency and competitive advantage.
    Add to Wishlist
    Download
    AI Customize
    Data analytics slide with a layered silhouette of a running person, numbered sections, and icons for each step.
    Add to Wishlist
    Download
    AI Customize
    Best Data Analysis PPT Slide Presentation
    Add to Wishlist
    Download
    AI Customize
    Slide featuring eight sections, each with a colored icons and text boxes arranged in two columns.
    Add to Wishlist
    Download
    AI Customize
    Three colored rectangles in orange, green, and teal, representing types of data stewards with text areas below.