Data Analysis PowerPoint Presentation and Google Slides

Pack of 13 slides
P.ID : 48028
Advertisement
1K+ views
166 Downloads
Get Custom Slides by Experts
Instantly Access Templates in PowerPoint

Data Analysis Presentation Slides

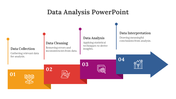
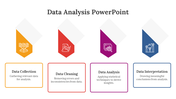
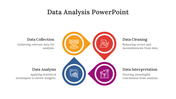
Data analysis is the process of inspecting, cleaning, transforming, and modeling data to uncover meaningful insights and support decision-making. It involves applying statistical techniques, data mining, and visualization tools to understand patterns, trends, and relationships within the data. By harnessing the power of data analysis, organizations can gain valuable information, make informed decisions, and drive business success. Let's utilize the data analysis template to extract valuable insights and unlock the full potential of our data.

Features of the templates:

  • 100% customizable slides and easy to download.
  • Slides are available in different nodes & colors.
  • The slide contains 16:9 and 4:3 formats.
  • Easy to change the colors of the slide quickly.
  • Highly compatible with PowerPoint and Google Slides.
  • Well-crafted template with an instant download facility.

You May Also Like These PowerPoint Templates

Add to Wishlist
Download
AI Customize
Slide featuring data science, data mining, and data analysis steps with placeholder text.
Add to Wishlist
Download
AI Customize
3D data visualization with charts on a tablet and two hexagonal stats, displayed on a dark blue background.
Add to Wishlist
Download
AI Customize
Visual representation of business benefits from data science, including improved efficiency and competitive advantage.
Add to Wishlist
Download
AI Customize
Data analytics slide with a layered silhouette of a running person, numbered sections, and icons for each step.
Add to Wishlist
Download
AI Customize
Best Data Analysis PPT Slide Presentation
Add to Wishlist
Download
AI Customize
Slide featuring eight sections, each with a colored icons and text boxes arranged in two columns.
Add to Wishlist
Download
AI Customize
Three colored rectangles in orange, green, and teal, representing types of data stewards with text areas below.
Add to Wishlist
Download
AI Customize
Data analytics slide displaying a circular diagram with sections from data backup to data quality with colored icons.
Add to Wishlist
Download
AI Customize
Central magnifying glass with surrounding icons representing different data analytics elements.
Add to Wishlist
Download
AI Customize
Environmental data slide with a bar chart displaying statistics for humans, trees, animals, and water with placeholder text.
Free
Add to Wishlist
Download
AI Customize
Data analysis slide with a business figure illustration and bar chart, featuring four colorful captions on a dark backdrop.
Add to Wishlist
Download
AI Customize
Slides featuring an overview of data aggregation processes with numbered steps in different colorful layout designs.
Free
Add to Wishlist
Download
AI Customize
Six hexagons in different colors encircling a central data icon, each labeled with numbers and captions.
Add to Wishlist
Download
AI Customize
A PowerPoint template outlining the responsibilities of a data scientist, featuring four key tasks in a diamond layout.
Add to Wishlist
Download
AI Customize
Three bar charts in red, blue, and green, with captions and text below each for data analysis insights.
Add to Wishlist
Download
AI Customize
Central red diamond with data chart icon, encircled by four red and white nodes forming a cross layout.
Add to Wishlist
Download
AI Customize
Data analytics slide with project progress bars from November to February, showing percentages for each month.
Add to Wishlist
Download
AI Customize
Applications of Data Science in retail marketing, including recommendation systems to inventory management with text.
Add to Wishlist
Download
AI Customize
Comparison slide with a green and blue area graph and demographic data with icons and percentage on the right.
Add to Wishlist
Download
AI Customize
Four hexagons in blue, teal, pink, and balck, each with icons and linked to a gray text box.
Add to Wishlist
Download
AI Customize
A structured chart of green bars, light and dark shades alternating, over a blue lined background with descriptive labels.
Add to Wishlist
Download
AI Customize
Line chart in green, red, and yellow with three product data columns paired with circular percentage boxes and text segments.
Add to Wishlist
Download
AI Customize
Data analytics template with a central magnifying glass and surrounding icons place with caption areas.
Add to Wishlist
Download
AI Customize
Data analysis template with a bar graph and illustrated dashboard layout with two caption areas for data.
Add to Wishlist
Download
AI Customize
Illustration of a person interacting with blue data visualization panels, with three numbered text sections on the right.
Add to Wishlist
Download
AI Customize
Illustration of essential data analytics elements in a visually connected with caption areas circular layout.
Add to Wishlist
Download
AI Customize
Banking data analysis slide with green bar chart on a computer screen and three listed issues in circles on the right.
Add to Wishlist
Download
AI Customize
Data analysis slide with a monitor showing analytics icons, and five colorful speech bubbles indicating various steps around it.
Add to Wishlist
Download
AI Customize
Slide with four icons representing Data Timeline, SSD, Data Level, and Hard Disk, with descriptions below each icon.