Business Data Analysis PowerPoint And Google Slides

Pack of 12 slides
P.ID : 56417
Advertisement
394 views
58 Downloads
Get Custom Slides by Experts
Instantly Access Templates in PowerPoint

Four Noded Ready-made Template


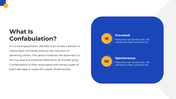
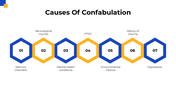
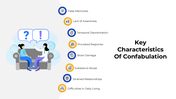
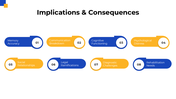
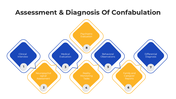
Find this potential data analysis presentation template to carry your various information related to your points related to the business theme. This wholesome template holds many features, so witness them get this template now! You can find the animation to be encountering with its colors and icons present inside them. The four nodes are filled with captions that provide you with all the facts during your explanation process.

Features of this template

  • 100% customizable slides and easy to download
  • Slides are available in different nodes & colors.
  • The slides contained 16:9 and 4:3 formats.
  • Easy to change the slide colors quickly.
  • Well-crafted template with instant download facility.
  • User-friendly options are provided.
  • The best qualities are loaded.

You May Also Like These PowerPoint Templates

Add to Wishlist
Download
AI Customize
Five colored diamond shapes representing data cleansing strategies, such as automated validation and error detection.
Add to Wishlist
Download
AI Customize
A data science slide with four colorful arrows labeled, from one to four each containing text and small descriptive icons.
Add to Wishlist
Download
AI Customize
Data classification slide with a central circular diagram divided into four segments, each connected to a text box.
Add to Wishlist
Download
AI Customize
Awesome Data Cleansing Structure PPT And Google Slides
Add to Wishlist
Download
AI Customize
Slide showing a metrics table on the left and a bar chart with orange and white bars on a blue gradient background.
Add to Wishlist
Download
AI Customize
Circular diagram with six colored segments around a central circle, illustrating the steps of data analysis.
Add to Wishlist
Download
AI Customize
Slide featuring data science, data mining, and data analysis steps with placeholder text.
Add to Wishlist
Download
AI Customize
3D data visualization with charts on a tablet and two hexagonal stats, displayed on a dark blue background.
Add to Wishlist
Download
AI Customize
Visual representation of business benefits from data science, including improved efficiency and competitive advantage.
Add to Wishlist
Download
AI Customize
Data analytics slide with a layered silhouette of a running person, numbered sections, and icons for each step.
Add to Wishlist
Download
AI Customize
Best Data Analysis PPT Slide Presentation
Add to Wishlist
Download
AI Customize
Slide featuring eight sections, each with a colored icons and text boxes arranged in two columns.
Add to Wishlist
Download
AI Customize
Three colored rectangles in orange, green, and teal, representing types of data stewards with text areas below.
Add to Wishlist
Download
AI Customize
Data analytics slide displaying a circular diagram with sections from data backup to data quality with colored icons.
Add to Wishlist
Download
AI Customize
Central magnifying glass with surrounding icons representing different data analytics elements.
Add to Wishlist
Download
AI Customize
Environmental data slide with a bar chart displaying statistics for humans, trees, animals, and water with placeholder text.
Free
Add to Wishlist
Download
AI Customize
Data analysis slide with a business figure illustration and bar chart, featuring four colorful captions on a dark backdrop.
Add to Wishlist
Download
AI Customize
Slides featuring an overview of data aggregation processes with numbered steps in different colorful layout designs.
Free
Add to Wishlist
Download
AI Customize
Six hexagons in different colors encircling a central data icon, each labeled with numbers and captions.
Add to Wishlist
Download
AI Customize
A PowerPoint template outlining the responsibilities of a data scientist, featuring four key tasks in a diamond layout.
Add to Wishlist
Download
AI Customize
Three bar charts in red, blue, and green, with captions and text below each for data analysis insights.
Add to Wishlist
Download
AI Customize
Central red diamond with data chart icon, encircled by four red and white nodes forming a cross layout.
Add to Wishlist
Download
AI Customize
Data analytics slide with project progress bars from November to February, showing percentages for each month.
Add to Wishlist
Download
AI Customize
Applications of Data Science in retail marketing, including recommendation systems to inventory management with text.
Add to Wishlist
Download
AI Customize
Comparison slide with a green and blue area graph and demographic data with icons and percentage on the right.