More Informative Data Analysis PPT Download For You


Excellent Data Analysis Slide For Presentation
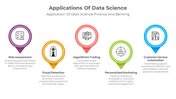
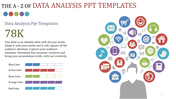
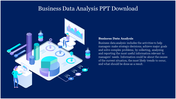
Get started with our high-quality Data analysis template to present your team analysis. Data analysis works to glean helpful information through its process, like identifying, collecting, cleaning, analyzing, and interpreting. It does the work of effective and efficient processes to value the data. Our slides can quickly present your ideas and help you make a perfect decision. The slide is well-designed to convey your content with its stunning visuals, icons, backgrounds, and themes. It features a unique circle design to wow the audience. Grab this creative design and enrich your presentation topic to the next level.
Features of the template
- 100% customizable slides and easy to download.
- Slides are available in different nodes & colors.
- The slide contained 16:9 and 4:3 formats.
- Easy to change the slide colors quickly.
- It is a well-crafted template with an instant download facility.
- Mind-blowing slide for the PowerPoint.
- Best presentation slide.


You May Also Like These PowerPoint Templates
Add to Wishlist
Download
AI Customize

Add to Wishlist
Download
AI Customize

Add to Wishlist
Download
AI Customize

Add to Wishlist
Download
AI Customize

Add to Wishlist
Download
AI Customize

Add to Wishlist
Download
AI Customize

Add to Wishlist
Download
AI Customize

Add to Wishlist
Download
AI Customize

Add to Wishlist
Download
AI Customize

Add to Wishlist
Download
AI Customize

Add to Wishlist
Download
AI Customize

Add to Wishlist
Download
AI Customize

Free
Add to Wishlist
Download
AI Customize

Add to Wishlist
Download
AI Customize

Add to Wishlist
Download
AI Customize

Add to Wishlist
Download
AI Customize

Add to Wishlist
Download
AI Customize

Add to Wishlist
Download
AI Customize

Add to Wishlist
Download
AI Customize

Add to Wishlist
Download
AI Customize
