Data Analysis Google Slides And PowerPoint Presentation


 Canva
Canva
Data Analysis PowerPoint, Google Slides, and Canva Template
Transform the way you present data with this sleek, professionally designed Data Analysis PowerPoint template. Built around a clean, modern aesthetic, this versatile deck gives analysts, educators, and business teams everything they need to break down complex data concepts — and turn raw numbers into compelling, decision-ready insights.
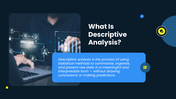
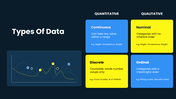
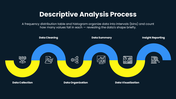
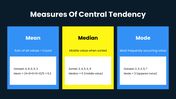
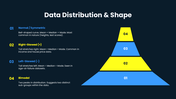
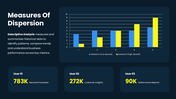
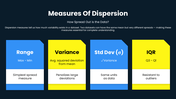
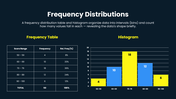
Every slide is crafted to communicate with clarity and confidence. From defining descriptive analysis and data types to walking through central tendency, dispersion, and frequency distributions, this template covers the full analytical workflow in a structured, visually engaging format that keeps your audience focused from the first slide to the last.
Whether you're presenting quarterly performance reports, teaching statistics to a classroom, or pitching data-driven strategies to leadership, this deck adapts to your context without losing its sharp, professional look. Editable charts, frequency tables, icon sets, and infographic shapes are all built in — so you spend less time designing and more time delivering insights that matter.
Fully customizable text, colors, and layouts mean you can tailor every slide to your brand or project in minutes — no design background required. Compatible with PowerPoint, Google Slides, and Canva, and available in both 16:9 and 4:3 formats, this template is built to perform wherever your presentation takes you.
Download it now and give your data the presentation it deserves.
Features of this template
- 100% customizable slides and easy to download.
- The slides contain 16:9 and 4:3 formats.
- Easy to change the colors quickly.
- Highly compatible with PowerPoint, Google Slides, and Canva templates.


You May Also Like These PowerPoint Templates


