Grab unbeatable Christmas Deals - 80% Discount
Buy Now!

Free - Data Lifecycle Management PowerPoint And Google Slides

Free
Pack of 15 slides
P.ID : 76734
Advertisement
1 views
1 Downloads
Get Custom Slides by Experts
Enhance Your Presentations with Add-ins
Google Slides Add-in
Access templates directly in Google Slides
Microsoft PowerPoint Add-in
Access templates directly in PowerPoint
GPT Add-on
AI-powered presentation assistance

Data Lifecycle Management PowerPoint, Google Slides, and Canva Template


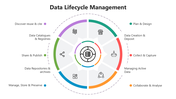
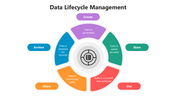
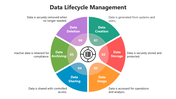
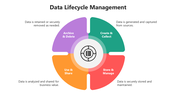
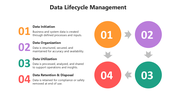
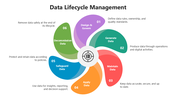
The Data Lifecycle Management Infographics Template is designed to visually explain how data is created, managed, utilized, stored, shared, and retired throughout its lifecycle. This 15-infographic slide deck presents complex data processes in a structured, easy-to-understand format, making it ideal for business, IT, analytics, and compliance presentations.

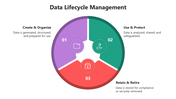
Each slide features modern infographic designs, clean layouts, clear typography, and meaningful icons to illustrate key stages such as data initiation, organization, utilization, protection, archiving, and deletion. These visuals help audiences quickly understand data governance, security, compliance, and operational workflows.

Fully editable and flexible, this template allows you to customize text, colors, icons, shapes, and layouts to match your organization’s branding and presentation needs. The slides are compatible with PowerPoint, Google Slides, and Canva, ensuring smooth editing and cross-platform usability.

This infographics slide deck is suitable for data governance presentations, IT strategy meetings, analytics training, compliance reporting, and executive briefings.

Download and use today
to clearly present Data Lifecycle Management concepts with professional visuals, logical flow, and strong visual impact.


Features of this template

  • 100% customizable slides and easy to download.
  • The slides contain 16:9 and 4:3 formats.
  • Easy to change the colors quickly.
  • Highly compatible with PowerPoint, Google Slides, and Canva templates.

You May Also Like These PowerPoint Templates

Add to Wishlist
Download
AI Customize
Five colored diamond shapes representing data cleansing strategies, such as automated validation and error detection.
Free
Add to Wishlist
Download
AI Customize
Data science responsibilities infographic with five U shaped blocks numbered from data collection to data storytelling.
Add to Wishlist
Download
AI Customize
Data analysis slide with a monitor showing analytics icons, and five colorful speech bubbles indicating various steps around it.
Add to Wishlist
Download
AI Customize
Illustration of a man holding a laptop with data visualization, alongside three numbered text sections with green arrows.
Add to Wishlist
Download
AI Customize
Big data analytics slide deck with colorful charts, showcasing types, benefits, and decision making aids.
Add to Wishlist
Download
AI Customize
Three colored rectangles in orange, green, and teal, representing types of data stewards with text areas below.
Add to Wishlist
Download
AI Customize
Colorful data analysis PowerPoint slide with three groups of progress bars showing percentages for each section.
Free
Add to Wishlist
Download
AI Customize
Data analysis slide with a business figure illustration and bar chart, featuring four colorful captions on a dark backdrop.
Add to Wishlist
Download
AI Customize
Pack of slide showcasing data collection methods with icons in different colors on a white backdrop.
Add to Wishlist
Download
AI Customize
Add to Wishlist
Download
AI Customize
Data analysis template with a bar graph and illustrated dashboard layout with two caption areas for data.
Add to Wishlist
Download
AI Customize
Applications of Data Science in retail marketing, including recommendation systems to inventory management with text.
Add to Wishlist
Download
AI Customize
Data science benefits visualized in a four step process with numbered colorful tabs in pink, green, orange, and blue.
Add to Wishlist
Download
AI Customize
Data analytics slide showing month wise vertical bars in varied colors, with July emphasized as top performing.
Add to Wishlist
Download
AI Customize
Illustration of a person interacting with blue data visualization panels, with three numbered text sections on the right.
Add to Wishlist
Download
AI Customize
Informative slides about data science, highlighting colorful different layout designs and icons.
Add to Wishlist
Download
AI Customize
Business data analysis graphic with target and arrows in center, surrounded by six colored captions with icons on both sides.