Creative Data Analysis PowerPoint And Google Slides

 Canva
Canva
Data Analysis PowerPoint, Google Slides, and Canva Template
The Data Analysis PowerPoint, Google Slides, and Canva Template is designed to help you present data in a simple, clear, and visually appealing way. With its clean layout and balanced color scheme, it makes your insights easier to understand while keeping your presentation professional and engaging.
This template includes fully editable slides, so you can quickly update text, charts, colors, and visuals to match your data and presentation needs. The design is flexible, allowing you to make changes easily without affecting the overall look and consistency.
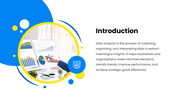
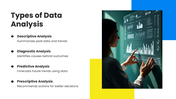
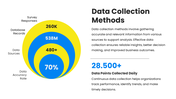
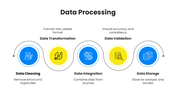
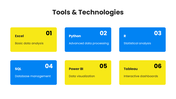
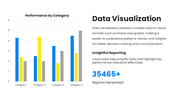
The slides follow a natural structure—starting with an introduction, then moving through data collection, processing, analysis types, tools, and visualization. It is well-suited for data analysts, business professionals, students, researchers, and corporate teams who want to present information in a clear and organized way.
Whether you're explaining trends, sharing reports, or presenting insights, this template helps you communicate your ideas with confidence. Download now and create presentations that turn data into clear, meaningful insights.
Features of this template
- 100% customizable slides and easy to download.
- The slides contain 16:9 and 4:3 formats.
- Easy to change the colors quickly.
- Highly compatible with PowerPoint, Google Slides, and Canva templates.


You May Also Like These PowerPoint Templates


