The Best Data Analysis PowerPoint And Canva Template
 Canva
Canva
Data Analysis PowerPoint, Google Slides, and Canva Template
Turn your numbers into clear stories with this modern Data Analysis PowerPoint Template. Designed with a clean multicolor theme, this template helps you present complex data in a simple, visual, and easy-to-understand way.
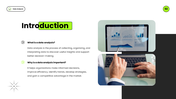
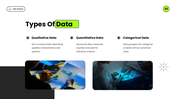
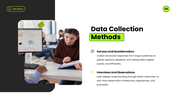
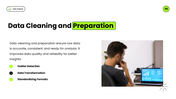
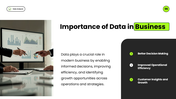
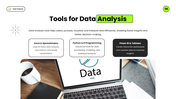
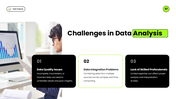
Data analysis is all about finding meaning in numbers. This template makes that process smooth and effective. It includes slides for data types, data collection methods, data cleaning, business insights, tools for analysis, challenges, and final conclusions. Every slide is structured to help your audience understand information step by step.
Whether you are a data analyst, business professional, student, or researcher, this template helps you explain insights clearly. Charts, graphs, and visual layouts make your data more engaging and easier to follow. Even complex topics become simple with well-designed slides.
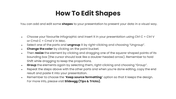
The modern design with bright highlights keeps your presentation professional and attractive. With fully editable shapes and layouts, you can quickly add your data, update charts, and customize everything to fit your needs.
Download now and present your data with clarity, confidence, and impact!
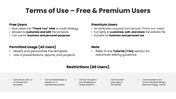
Features of this template
- 100% customizable slides and easy to download.
- The slides contain 16:9 and 4:3 formats.
- Easy to change the colors quickly.
- Highly compatible with PowerPoint, Google Slides, and Canva templates.


You May Also Like These PowerPoint Templates


