Innovative Data Analysis PowerPoint And Google Slides


 Canva
Canva
Data Analysis PowerPoint, Google Slides, and Canva Template
Present your data with clarity and confidence using this modern Data Analysis PowerPoint Template. Designed with a sleek purple color theme, this template brings a professional and smart look to your data-driven presentations.
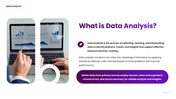
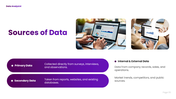
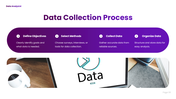
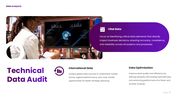
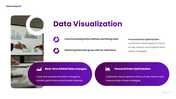
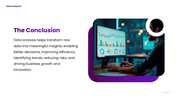
Data analysis is about turning raw numbers into meaningful insights. This template helps you do that easily. It includes well-structured slides for data sources, data collection, cleaning and preparation, visualization, technical audit, and business insights. Each slide guides your audience step by step, making complex information simple to understand.
The purple theme adds a premium and modern feel, making your presentation stand out in meetings, classrooms, or business reviews. With clean layouts and visual elements like charts and icons, your data becomes more engaging and easy to follow.
Whether you are a data analyst, business professional, researcher, or student, this template helps you communicate insights clearly and effectively.
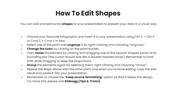
All slides come with fully editable shapes and elements, so you can quickly update charts, change content, and match your branding without any hassle.
Download now and turn your data into powerful, easy-to-understand stories!
Features of this template
- 100% customizable slides and easy to download.
- The slides contain 16:9 and 4:3 formats.
- Easy to change the colors quickly.
- Highly compatible with PowerPoint, Google Slides, and Canva templates.


You May Also Like These PowerPoint Templates


Showing36 of69,218 templates