Slidea Logo
Try it now — the new, easy way to turn your slides into an interactive experience.
Explore Now

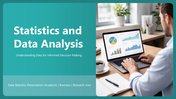
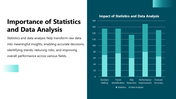
Statistics and Data Analysis Presentation And Google Slides

Pack of 18 slides
P.ID : 77062
Advertisement
3 views
1 Downloads
Get Custom Slides by Experts
Enhance Your Presentations with Add-ins
Google Slides Add-in
Access templates directly in Google Slides
Microsoft PowerPoint Add-in
Access templates directly in PowerPoint
GPT Add-on
AI-powered presentation assistance

Statistics and Data Analysis PowerPoint, Google Slides, and Canva Template


The Statistics and Data Analysis PowerPoint Template is designed to help educators, analysts, and business teams present data-driven insights in a clear and structured way. It supports a complete analytical narrative—from understanding raw data to interpreting results—using clean layouts and professional data visuals.

This template covers core statistical concepts such as the basics of statistics, data collection and organization, types of statistics, and data analysis methods. It also includes slides on quantitative and qualitative data, commonly used statistical tools, and the practical importance of data analysis in academic and business decision-making. Each slide simplifies complex topics, making insights easy to explain and understand.

Ideal for students, teachers, researchers, analysts, and corporate professionals, this presentation works well for classroom learning, project reviews, training sessions, and business reports. All slides are fully editable, allowing you to customize text, charts, graphs, and visuals to match your data, audience, and presentation goals.


Features of this template

  • 100% customizable slides and easy to download.
  • The slides contain 16:9 and 4:3 formats.
  • Easy to change the colors quickly.
  • Highly compatible with PowerPoint, Google Slides, and Canva templates.

You May Also Like These PowerPoint Templates

Add to Wishlist
Download
AI Customize
Colorful data analysis PowerPoint slide with three groups of progress bars showing percentages for each section.
Add to Wishlist
Download
AI Customize
Illustration of a person interacting with blue data visualization panels, with three numbered text sections on the right.
Add to Wishlist
Download
AI Customize
Data science benefits visualized in a four step process with numbered colorful tabs in pink, green, orange, and blue.
Add to Wishlist
Download
AI Customize
Free
Add to Wishlist
Download
AI Customize
Data science responsibilities infographic with five U shaped blocks numbered from data collection to data storytelling.
Add to Wishlist
Download
AI Customize
Five colored diamond shapes representing data cleansing strategies, such as automated validation and error detection.
Add to Wishlist
Download
AI Customize
Illustration of a man holding a laptop with data visualization, alongside three numbered text sections with green arrows.
Add to Wishlist
Download
AI Customize
Three colored rectangles in orange, green, and teal, representing types of data stewards with text areas below.
Add to Wishlist
Download
AI Customize
Business data analysis graphic with target and arrows in center, surrounded by six colored captions with icons on both sides.
Add to Wishlist
Download
AI Customize
Data analysis slide with a monitor showing analytics icons, and five colorful speech bubbles indicating various steps around it.
Add to Wishlist
Download
AI Customize
Data analytics slide showing month wise vertical bars in varied colors, with July emphasized as top performing.
Add to Wishlist
Download
AI Customize
Applications of Data Science in retail marketing, including recommendation systems to inventory management with text.
Add to Wishlist
Download
AI Customize
Big data analytics slide deck with colorful charts, showcasing types, benefits, and decision making aids.
Add to Wishlist
Download
AI Customize
Informative slides about data science, highlighting colorful different layout designs and icons.
Free
Add to Wishlist
Download
AI Customize
Data analysis slide with a business figure illustration and bar chart, featuring four colorful captions on a dark backdrop.
Add to Wishlist
Download
AI Customize
Pack of slide showcasing data collection methods with icons in different colors on a white backdrop.
Add to Wishlist
Download
AI Customize
Data analysis template with a bar graph and illustrated dashboard layout with two caption areas for data.