Data Analysis PowerPoint and Google Slides Templates


 Canva
Canva
Data Analysis PowerPoint, Google Slides, and Canva Template
Raw data sitting in a spreadsheet tells nobody anything — but a well-structured presentation that walks an audience through analysis types, process steps, tools, and real-world applications tells a story that drives decisions. This Data Analysis PowerPoint Templates deck was built for exactly that purpose. Designed for data professionals, business intelligence teams, analytics educators, corporate trainers, and management students, this template gives you a complete, logically sequenced, and visually clean presentation that covers the full landscape of data analysis from definition to future outlook.
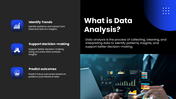
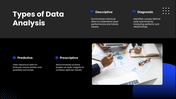
What makes this deck genuinely different is how comprehensively it covers the subject without ever feeling overwhelming. It opens with a focused and accessible introduction to data analysis — framing it as the process of collecting, cleaning, and interpreting data to identify patterns and support better decision-making, with three clear use cases: identifying trends, supporting decisions, and predicting outcomes. The types of data analysis slide immediately adds depth by presenting all four analytical categories in one structured view — descriptive analysis for understanding past performance, diagnostic analysis for uncovering root causes, predictive analysis for forecasting future trends, and prescriptive analysis for recommending optimal actions — giving audiences a complete mental map of how analytics work across different business needs.
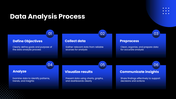
The data analysis process slide is one of the most practically valuable in the deck, mapping the end-to-end analytical workflow across six clearly defined stages — defining objectives, collecting data, preprocessing, analyzing, visualizing results, and communicating insights — each explained with a concise action statement that makes the sequence both memorable and immediately applicable. The essential tools and technologies slide rounds up the professional toolkit every analyst should know — covering Excel, Power BI, Tableau, Python, SQL, and R — positioning each as serving a specific role across collection, cleaning, visualization, analysis, and reporting workflows.
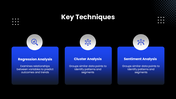
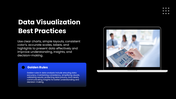
The key techniques slide introduces three powerful analytical methods — regression analysis for variable relationship and trend prediction, cluster analysis for pattern identification and segmentation, and sentiment analysis for understanding data grouped by attitude or opinion — giving audiences a working vocabulary for the most commonly applied approaches in modern data work. A real-world applications slide demonstrates how data analysis creates measurable value across industries — from tracking sales and customer behavior to inventory management — making the subject feel directly connected to business outcomes rather than purely theoretical. The data visualization best practices slide delivers both a set of golden rules for creating effective charts and layouts, and a second set of principles for maintaining analytical integrity — covering data accuracy, consistency, result validation, and privacy protection in a format that any analyst or presenter can put to use immediately.
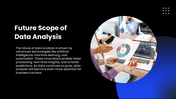
The challenges in data analysis slide presents an honest picture of what makes data work difficult in practice — poor data quality, missing data, security issues, lack of skilled resources, and high data volume — visualized through a chart that shows the relative weight of each challenge across the field. A forward-looking future scope of data analysis slide closes the presentation by connecting the discipline to the technologies reshaping it — artificial intelligence, machine learning, and automation — and making a compelling case for why data analysis will only grow in strategic importance for businesses of every kind.
Everything across all slides is fully customizable — process steps, tool names, technique descriptions, challenge data, chart values, and color schemes — so you can shape this template around your specific industry, course, or organizational context without any design experience needed. Whether you are leading a corporate analytics training, presenting a business intelligence strategy, teaching a data science module, or pitching an analytics capability to leadership, this template gives your presentation the structure and visual quality that makes complex data concepts genuinely easy to understand. Download it now and present data analysis with the confidence and clarity it deserves.
Features of this template
- 100% customizable slides and easy to download.
- The slides contain 16:9 and 4:3 formats.
- Easy to change the colors quickly.
- Highly compatible with PowerPoint, Google Slides, and Canva templates.


You May Also Like These PowerPoint Templates


