Qualitative Data Analysis PowerPoint And Google Slides


 Canva
Canva
Qualitative Data Analysis PowerPoint, Google Slides, and Canva Template
Numbers only tell half the story — and this template is built for the other half. If you are presenting qualitative research findings, explaining data coding processes, or teaching the fundamentals of human-centered research to an audience, this Qualitative Data Analysis PPT gives you a clean, academically structured, and visually engaging deck that covers every essential aspect of qualitative analysis from introduction to real-world application. Built for academic researchers, social science educators, business analysts, UX researchers, and postgraduate students, this template transforms one of the most nuanced research disciplines into a presentation any audience can follow with confidence.
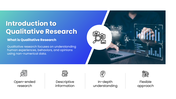
The deck is designed to build understanding progressively — each slide connecting naturally to the next, creating a coherent research narrative from definition to conclusion. It opens with a focused introduction to qualitative research that defines the discipline as the study of human experiences, behaviors, and opinions through non-numerical data — framing its four core characteristics as open-ended inquiry, descriptive information gathering, in-depth understanding, and a flexible research approach that adapts to the complexity of human behavior.
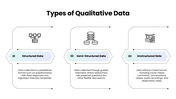
The types of qualitative data slide maps three distinct data formats — structured data collected through predefined formats like fixed-response questionnaires, semi-structured data gathered through guided but flexible interview conversations, and unstructured data drawn from social media comments, audio recordings, and observational notes — giving researchers and students a clear taxonomy for understanding how qualitative data is collected and categorized. The data coding and classification slide then explains one of the most critical steps in qualitative analysis — covering the four-stage coding process of reading data carefully, identifying repeated patterns and keywords, assigning meaningful labels to important information, and grouping similar codes into overarching themes that reveal deeper insights.
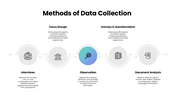
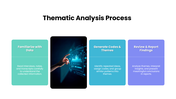
The methods of data collection slide presents five research methods that qualitative analysts rely on — one-on-one interviews for collecting detailed personal experiences, focus groups for capturing shared perspectives through small group discussion, observation for gathering real-time behavioral data in natural environments, surveys and questionnaires for structured opinion gathering, and document analysis for extracting meaningful information from reports, records, and written materials. The thematic analysis process slide follows with a clean three-stage framework — familiarizing with the data through careful reading of transcripts and notes, generating codes and themes by identifying patterns and grouping similar ideas, and reviewing and reporting findings by interpreting themes into meaningful conclusions.
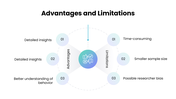
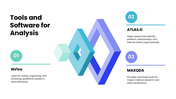
The advantages and limitations slide provides an honest and balanced view of qualitative research — presenting detailed insights, rich understanding of behavior, and contextual depth on the advantages side, against time intensity, smaller sample sizes, and potential researcher bias on the limitations side — giving audiences the academic integrity they expect from a credible research presentation. The tools and software slide introduces three leading qualitative analysis platforms — NVivo for efficient coding and data organization, ATLAS.ti for identifying patterns and relationships within large datasets, and MAXQDA for mixed-method research and advanced data visualization — equipping practitioners with a clear overview of the technology available to them.
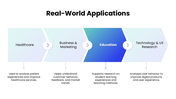
The real-world applications slide demonstrates how qualitative data analysis creates tangible value across four industries — healthcare for understanding patient experiences and improving services, business and marketing for analyzing customer behavior and feedback, education for researching student learning experiences, and technology and UX research for analyzing user behavior to improve digital products. A grounded conclusion ties the full narrative together by connecting qualitative analysis directly to better decision-making, improved research accuracy, and its broad applicability across every major field of study and practice.
Everything is fully customizable — data type descriptions, coding stages, collection methods, tool names, application areas, color schemes, and layout elements — no design experience needed. Download the Qualitative Data Analysis PPT today and present the science of human understanding with the depth, structure, and clarity it truly deserves.
Features of this template
- 100% customizable slides and easy to download.
- The slides contain 16:9 and 4:3 formats.
- Easy to change the colors quickly.
- Highly compatible with PowerPoint, Google Slides, and Canva templates.


You May Also Like These PowerPoint Templates


