The Data Analysis PPT Presentation And Google Slides

Pack of 17 slides
P.ID : 13723
Advertisement
794 views
120 Downloads
Get Custom Slides by Experts
Enhance Your Presentations with Add-ins
Google Slides Add-in
Access templates directly in Google Slides
Microsoft PowerPoint Add-in
Access templates directly in PowerPoint
GPT Add-on
AI-powered presentation assistance

Data Analysis PowerPoint, Google Slides, and Canva Template


Make your numbers speak clearly with this smart and modern Data Analysis PowerPoint Template. Designed with a clean multicolor theme, this template helps you present complex data in a simple and engaging way.

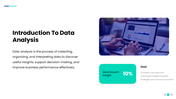
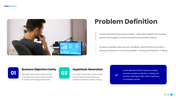
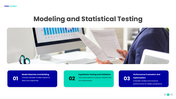
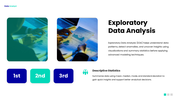
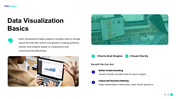
Data analysis is all about understanding information and making better decisions. This template is built to guide your audience step by step—from data collection and cleaning to visualization and insights. Each slide is thoughtfully designed to explain your ideas clearly, even to someone new to the topic.

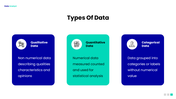
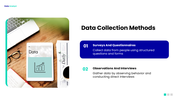
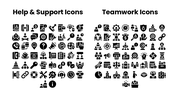
With a balance of colors, visuals, and structured layouts, your presentation becomes more attractive and easy to follow. Charts, icons, and infographics help turn raw data into meaningful stories that your audience will remember.

Whether you are creating a business report, research presentation, dashboard summary, or academic project, this template gives you a professional edge.

All elements are fully editable, so you can quickly customize text, colors, charts, and layouts based on your needs. No design skills needed—just add your data and present with confidence.

Start now and turn your data into clear, powerful insights!


Features of this template

  • 100% customizable slides and easy to download.
  • The slides contain 16:9 and 4:3 formats.
  • Easy to change the colors quickly.
  • Highly compatible with PowerPoint, Google Slides, and Canva templates.

You May Also Like These PowerPoint Templates

Add to Wishlist
Download
AI Customize
An infographic slide illustrating the skills and responsibilities of a data scientist in a colorful circular model.
Add to Wishlist
Download
AI Customize
Data analytics slide showing month wise vertical bars in varied colors, with July emphasized as top performing.
Add to Wishlist
Download
AI Customize
Business data analysis graphic with target and arrows in center, surrounded by six colored captions with icons on both sides.
Add to Wishlist
Download
AI Customize
Four colored diamond shapes with curved arrows in the center, surrounded by captions and percentage circles.
Add to Wishlist
Download
AI Customize
Central magnifying glass with a green graph, surrounded by six data related icons arranged circularly.
Add to Wishlist
Download
AI Customize
Data analytics template featuring a central magnifying glass and six surrounding icons and caption areas.
Add to Wishlist
Download
AI Customize
Two caption data analysis slide with text on a dark background and a segmented circular chart with icon on the right.
Add to Wishlist
Download
AI Customize
Data cleansing with circular infographic of eight colored steps around a central icon, plus strategy and process slides.
Add to Wishlist
Download
AI Customize
Data migration slide set with process diagram, flowcharts, timeline steps, database icons, and hexagonal stage breakdowns.
Add to Wishlist
Download
AI Customize
Slide deck showing data valuation methods, using colorful arrows, text boxes, and icons in a clean and modern layout.
Add to Wishlist
Download
AI Customize
Data scientist roles and responsibilities slide deck with  numbered infographics across seven layouts showing key tasks.
Add to Wishlist
Download
AI Customize
Data classification slides illustrate a circular process with four steps with different layout designs and icons.
Add to Wishlist
Download
AI Customize
A visual diagram explaining the key responsibilities of a data scientist in color coded arrows on a white backdrop.
Add to Wishlist
Download
AI Customize
A flowchart slides illustrating the data hygiene process with steps in different layout designs accompanied by icons.
Add to Wishlist
Download
AI Customize
Slide deck comparing the roles of data scientist and engineer, with color coded sections and clear definitions.
Add to Wishlist
Download
AI Customize
A PPT slide showing various data visualization charts and graphs for data analysis with placeholder text on a blue theme.
Add to Wishlist
Download
AI Customize
Data scrubbing process diagram PPT slides showcasing steps with different colorful layout designs and icons.
Free
Add to Wishlist
Download
AI Customize
Monthly production analysis chart with three color-coded products pink, purple, and blue bars for January to July.
Add to Wishlist
Download
AI Customize
A collection of business data analysis PPT slides with colorful charts and infographics with icons on a white backdrop.
Add to Wishlist
Download
AI Customize
PPT slide for data analysis template, featuring icons like a magnifying glass, coffee cup, and open book with captions.
Add to Wishlist
Download
AI Customize
Colorful data analysis PowerPoint slide with three groups of progress bars showing percentages for each section.
Add to Wishlist
Download
AI Customize
Data analysis slide with three sections represented by color coded icons with placeholder text.
Add to Wishlist
Download
AI Customize
Data analytics PPT slide showing four key areas from analysing data patterns to enhancing business performance.
Add to Wishlist
Download
AI Customize
Slide featuring five pentagons in yellow, pink, green, purple, and blue, representing the benefits of studying data science.
Add to Wishlist
Download
AI Customize
Data cleansing cycle PowerPoint slides with different colorful layout designs with icons and text descriptions.
Add to Wishlist
Download
AI Customize
Illustration of a man holding a laptop with data visualization, alongside three numbered text sections with green arrows.
Add to Wishlist
Download
AI Customize
Data analysis PowerPoint featuring an illustration of data charts and various slides layouts for analysis steps.
Add to Wishlist
Download
AI Customize
Data analysis template featuring a magnifying glass graphic, numbered sections, and placeholder blocks.
Free
Add to Wishlist
Download
AI Customize
Data analysis template with two circular progress charts displaying 70% and 45% and six labeled captions with text area.
Add to Wishlist
Download
AI Customize
Informative slides about data science, highlighting colorful different layout designs and icons.