Creative Data Migration PowerPoint And Google Slides Themes

Pack of 11 slides
P.ID : 72386
Advertisement
506 views
75 Downloads
Get Custom Slides by Experts
Enhance Your Presentations with Add-ins
Google Slides Add-in
Access templates directly in Google Slides
Microsoft PowerPoint Add-in
Access templates directly in PowerPoint
GPT Add-on
AI-powered presentation assistance

Creative Data Migration Presentation Slides


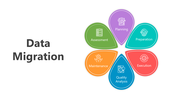
Data migration is the process of transferring data between different storage systems, formats, or computer environments. It is a critical task in IT management, often undertaken during upgrades, consolidations, or system replacements. Data migration ensures that all relevant data is accurately and securely moved to the new environment without loss or corruption.

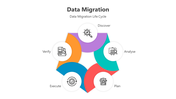
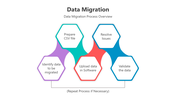
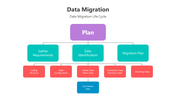
This process involves careful planning, data mapping, extraction, transformation, and loading (ETL), followed by rigorous testing to validate the integrity of the migrated data. Successful data migration is crucial for maintaining business continuity, enhancing system performance, and enabling the adoption of new technologies or platforms. This Data Migration templates is ideal for IT professionals, project managers, data analysts, and consultants involved in data migration projects.

With fully editable slides, users can customize content to detail each phase of the data migration process, including planning, execution, and validation. The template includes visually appealing graphics, flowcharts, and diagrams to illustrate complex concepts, making it easier to communicate strategies and methodologies.

By utilizing this template, presenters can deliver clear and comprehensive presentations that educate stakeholders on best practices, potential challenges, and solutions in data migration. Download this template now to streamline your data migration presentations and ensure successful and efficient data transfer projects.

Features of this templates


  • 100% customizable slides and easy to download.
  • The slide contains 16:9 and 4:3 formats.
  • Easy to change the colors of the slide quickly.
  • Highly compatible with PowerPoint and Google Slides.

You May Also Like These PowerPoint Templates

Add to Wishlist
Download
AI Customize
Four hexagons in blue, teal, pink, and balck, each with icons and linked to a gray text box.
Add to Wishlist
Download
AI Customize
Data analytics presentation template with dashboards, insights, predictive metrics, and business growth visuals clean UI.
Add to Wishlist
Download
AI Customize
Data analytics layout featuring a central gray magnifying glass and three orange icons linked to labeled sections.
Add to Wishlist
Download
AI Customize
Line chart in green, red, and yellow with three product data columns paired with circular percentage boxes and text segments.
Add to Wishlist
Download
AI Customize
Illustration of a magnifying glass in gray with red icon and two text elements, highlighting data analysis themes.
Add to Wishlist
Download
AI Customize
Data analytics template with a central magnifying glass and surrounding icons place with caption areas.
Add to Wishlist
Download
AI Customize
Data analysis template with a bar graph and illustrated dashboard layout with two caption areas for data.
Add to Wishlist
Download
AI Customize
Illustration of a person interacting with blue data visualization panels, with three numbered text sections on the right.
Add to Wishlist
Download
AI Customize
Illustration of essential data analytics elements in a visually connected with caption areas circular layout.
Add to Wishlist
Download
AI Customize
Slide with four icons representing Data Timeline, SSD, Data Level, and Hard Disk, with descriptions below each icon.
Add to Wishlist
Download
AI Customize
PowerPoint slide showing a bar chart with four sections with color coded bars and placeholder text.
Add to Wishlist
Download
AI Customize
Data analysis presentation template covering descriptive analysis, data types, distribution, trends, and insights.
Add to Wishlist
Download
AI Customize
Data analytics PowerPoint template featuring two sections with blue icons for web data and chart analysis.
Add to Wishlist
Download
AI Customize
Data analytics PowerPoint template with six sections, each with gray icons representing data, charts, and analytics.
Add to Wishlist
Download
AI Customize
An infographic slide illustrating the skills and responsibilities of a data scientist in a colorful circular model.
Add to Wishlist
Download
AI Customize
Data analytics slide showing month wise vertical bars in varied colors, with July emphasized as top performing.
Add to Wishlist
Download
AI Customize
Business data analysis graphic with target and arrows in center, surrounded by six colored captions with icons on both sides.
Add to Wishlist
Download
AI Customize
Four colored diamond shapes with curved arrows in the center, surrounded by captions and percentage circles.
Add to Wishlist
Download
AI Customize
Central magnifying glass with a green graph, surrounded by six data related icons arranged circularly.
Add to Wishlist
Download
AI Customize
Data analytics template featuring a central magnifying glass and six surrounding icons and caption areas.
Add to Wishlist
Download
AI Customize
Two caption data analysis slide with text on a dark background and a segmented circular chart with icon on the right.
Add to Wishlist
Download
AI Customize
Data cleansing with circular infographic of eight colored steps around a central icon, plus strategy and process slides.
Add to Wishlist
Download
AI Customize
Data migration slide set with process diagram, flowcharts, timeline steps, database icons, and hexagonal stage breakdowns.
Add to Wishlist
Download
AI Customize
Slide deck showing data valuation methods, using colorful arrows, text boxes, and icons in a clean and modern layout.
Add to Wishlist
Download
AI Customize
Data scientist roles and responsibilities slide deck with  numbered infographics across seven layouts showing key tasks.
Add to Wishlist
Download
AI Customize
Data classification slides illustrate a circular process with four steps with different layout designs and icons.
Add to Wishlist
Download
AI Customize
A visual diagram explaining the key responsibilities of a data scientist in color coded arrows on a white backdrop.
Add to Wishlist
Download
AI Customize
A flowchart slides illustrating the data hygiene process with steps in different layout designs accompanied by icons.
Add to Wishlist
Download
AI Customize
Slide deck comparing the roles of data scientist and engineer, with color coded sections and clear definitions.