Guaranteed Data Analysis PPT Template For Presentation

Colorful data analysis PowerPoint slide with three groups of progress bars showing percentages for each section.
P.ID : 47844
    11 slides
    Slide pack showing vibrant segments with colorful process diagrams, representing elements of mixed methods research.
    11 slides
    A data science slide with four colorful arrows labeled, from one to four each containing text and small descriptive icons.
    16 slides
    Collection of slides detailing data analysis techniques, with colorful numbered blocks and varied infographic designs.
    11 slides
    Data quality management slides with different colorful layout designs and text descriptions.
    342 views
    42 Downloads
    Get Custom Slides by Experts
    Instantly Access Templates in PowerPoint

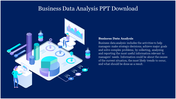
    Multicolor Professional Slide For Data Analysis

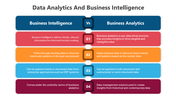
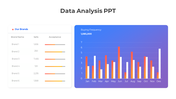
    Get started to make professional presentations with our data analysis PPT template. This informative slide lets you easily understand the data to improve customer experience, reduce operational costs, and find better problem-solving methods. It will help you in the process of discovering useful information for your business. This slide includes three nodes with multicolor bars filled with various percentage levels for quick analysis. The blue background with an HD image makes this slide looks fantastic. The graphs, background, nodes, and theme colors are 100% editable to satisfy your requirements. Rush to grab!

    Features of the template

    • 100% customizable slides and easy to download.
    • Slides are available in different nodes & colors.
    • The slide contains 16:9 and 4:3 formats.
    • Easy to change the colors of the slide quickly.
    • Well-crafted template with an instant download facility.
    • Professional-looking business slide.
    Advertisement

    You May Also Like These PowerPoint Templates

    Add to Wishlist
    Download
    AI Customize
    Data analytics slide with a layered silhouette of a running person, numbered sections, and icons for each step.
    Add to Wishlist
    Download
    AI Customize
    Best Data Analysis PPT Slide Presentation
    Add to Wishlist
    Download
    AI Customize
    Slide featuring eight sections, each with a colored icons and text boxes arranged in two columns.
    Add to Wishlist
    Download
    AI Customize
    Three colored rectangles in orange, green, and teal, representing types of data stewards with text areas below.
    Add to Wishlist
    Download
    AI Customize
    Data analytics slide displaying a circular diagram with sections from data backup to data quality with colored icons.
    Add to Wishlist
    Download
    AI Customize
    Central magnifying glass with surrounding icons representing different data analytics elements.
    Add to Wishlist
    Download
    AI Customize
    Environmental data slide with a bar chart displaying statistics for humans, trees, animals, and water with placeholder text.
    Free
    Add to Wishlist
    Download
    AI Customize
    Data analysis slide with a business figure illustration and bar chart, featuring four colorful captions on a dark backdrop.
    Add to Wishlist
    Download
    AI Customize
    Slides featuring an overview of data aggregation processes with numbered steps in different colorful layout designs.
    Free
    Add to Wishlist
    Download
    AI Customize
    Six hexagons in different colors encircling a central data icon, each labeled with numbers and captions.
    Add to Wishlist
    Download
    AI Customize
    A PowerPoint template outlining the responsibilities of a data scientist, featuring four key tasks in a diamond layout.
    Add to Wishlist
    Download
    AI Customize
    Three bar charts in red, blue, and green, with captions and text below each for data analysis insights.
    Add to Wishlist
    Download
    AI Customize
    Central red diamond with data chart icon, encircled by four red and white nodes forming a cross layout.
    Add to Wishlist
    Download
    AI Customize
    Data analytics slide with project progress bars from November to February, showing percentages for each month.
    Add to Wishlist
    Download
    AI Customize
    Applications of Data Science in retail marketing, including recommendation systems to inventory management with text.
    Add to Wishlist
    Download
    AI Customize
    Comparison slide with a green and blue area graph and demographic data with icons and percentage on the right.