Support Model Diagram for PowerPoint


Support Model Diagram — PowerPoint Template
Spending hours building slides from scratch is time you don't have. A ready-made, fully editable template gets you to a polished presentation in minutes — not hours.
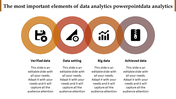
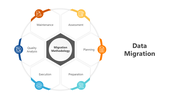
This Support Model Diagram gives you a clean, fully editable presentation slide that's ready to use the moment you download it. The slide features support model diagram with six colorful triangles with icons showing data driven, cost efficient, and flexible strategies. Drop it into your deck, replace the placeholder text, and you're done.
What's Inside
A focused single-slide design — built for one strong visual message, fast to customize — text, colors, icons, and layout are all yours to adjust. Design variations include: Support Model Diagram, Support Model, Technical Support Model, Support Model Infographic. Match your brand, adapt the layout, change the colors — it takes minutes, not hours.
Who This Is For
Built for professionals, students, educators, and anyone who needs a polished, ready-to-use presentation template. No design background needed — just open, edit, and present.
Formats & Download
Available for PowerPoint. Download instantly — no design skills required. Everything is fully customizable to match your brand or topic.
Key Features
- Fully editable — text, colors, icons, and layout
- Compatible with PowerPoint
- 16:9 widescreen format — presentation-ready
- Clean, professional design — no clutter
- Premium — instant download access
Explore more Data Analysis PowerPoint templates to find the right fit for your next presentation.


You May Also Like These PowerPoint Templates


