Data Scientist Responsibilities Google Slides Templates

Pack of 13 slides
P.ID : 71353
Advertisement
160 views
27 Downloads
Get Custom Slides by Experts
Instantly Access Templates in PowerPoint

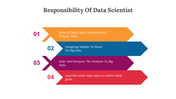
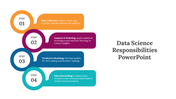
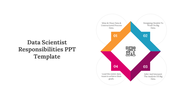
Data Scientist Responsibilities Presentation Slides


Are you curious about the world of data science and the technology it entails? Data scientists play a pivotal role in today's data-driven world, leveraging cutting-edge technology to help organizations make informed decisions. Their responsibilities encompass collecting, analyzing, and interpreting vast datasets using advanced technological tools to extract valuable insights. These professionals employ statistical techniques, machine learning algorithms, and data visualization technology to uncover patterns, trends, and correlations. In addition to their technical skills, data scientists possess strong problem-solving abilities and effective communication skills to convey their findings to non-technical stakeholders. They serve as the bridge between raw data and actionable strategies, contributing significantly to business growth and innovation. Whether you're a data scientist looking to present your findings or an educator explaining data science concepts, this technology PPT template is tailored for you. Its user-friendly design and fully editable slides make it an invaluable tool for creating engaging and informative presentations. With a range of customizable layouts and visually appealing graphics, this template simplifies the process of conveying complex data science concepts using state-of-the-art technology. By using this template, you'll not only save time but also captivate your audience with professional and visually appealing slides. Unlock the benefits of streamlined data presentation, and encourage your audience to embrace the power of data science and technology with this versatile template.


Features of the templates:


  • 100% customizable slides and easy to download.
  • Slides are available in different nodes & colors.
  • The slide contains 16:9 and 4:3 formats.
  • Easy to change the colors of the slide quickly.
  • Highly compatible with PowerPoint and Google Slides.
  • Well-crafted template with an instant download facility.

You May Also Like These PowerPoint Templates

Add to Wishlist
Download
AI Customize
Data classification slide with a central circular diagram divided into four segments, each connected to a text box.
Add to Wishlist
Download
AI Customize
Awesome Data Cleansing Structure PPT And Google Slides
Add to Wishlist
Download
AI Customize
Slide showing a metrics table on the left and a bar chart with orange and white bars on a blue gradient background.
Add to Wishlist
Download
AI Customize
Circular diagram with six colored segments around a central circle, illustrating the steps of data analysis.
Free
Add to Wishlist
Download
AI Customize
Five step data cleansing process, featuring stages represented with colorful icons.
Add to Wishlist
Download
AI Customize
Slide featuring data science, data mining, and data analysis steps with placeholder text.
Add to Wishlist
Download
AI Customize
3D data visualization with charts on a tablet and two hexagonal stats, displayed on a dark blue background.
Add to Wishlist
Download
AI Customize
Visual representation of business benefits from data science, including improved efficiency and competitive advantage.
Add to Wishlist
Download
AI Customize
Data analytics slide with a layered silhouette of a running person, numbered sections, and icons for each step.
Add to Wishlist
Download
AI Customize
Big data analytics slide deck with colorful charts, showcasing types, benefits, and decision making aids.
Add to Wishlist
Download
AI Customize
Best Data Analysis PPT Slide Presentation
Add to Wishlist
Download
AI Customize
Slide featuring eight sections, each with a colored icons and text boxes arranged in two columns.
Add to Wishlist
Download
AI Customize
Three colored rectangles in orange, green, and teal, representing types of data stewards with text areas below.
Add to Wishlist
Download
AI Customize
Data analytics slide displaying a circular diagram with sections from data backup to data quality with colored icons.
Add to Wishlist
Download
AI Customize
Central magnifying glass with surrounding icons representing different data analytics elements.
Add to Wishlist
Download
AI Customize
Environmental data slide with a bar chart displaying statistics for humans, trees, animals, and water with placeholder text.
Free
Add to Wishlist
Download
AI Customize
Data analysis slide with a business figure illustration and bar chart, featuring four colorful captions on a dark backdrop.
Add to Wishlist
Download
AI Customize
Slides featuring an overview of data aggregation processes with numbered steps in different colorful layout designs.
Free
Add to Wishlist
Download
AI Customize
Six hexagons in different colors encircling a central data icon, each labeled with numbers and captions.
Add to Wishlist
Download
AI Customize
A PowerPoint template outlining the responsibilities of a data scientist, featuring four key tasks in a diamond layout.
Add to Wishlist
Download
AI Customize
Three bar charts in red, blue, and green, with captions and text below each for data analysis insights.
Add to Wishlist
Download
AI Customize
A data analytics slide featuring a magnifying glass icon at the center, surrounded by sections for various analytics topics.
Add to Wishlist
Download
AI Customize
Central red diamond with data chart icon, encircled by four red and white nodes forming a cross layout.
Free
Add to Wishlist
Download
AI Customize
Bar chart with five vertical bars representing data analysis with various high, low, and volume indicators displayed.
Add to Wishlist
Download
AI Customize
Data analytics slide with project progress bars from November to February, showing percentages for each month.
Add to Wishlist
Download
AI Customize
Applications of Data Science in retail marketing, including recommendation systems to inventory management with text.
Add to Wishlist
Download
AI Customize
Comparison slide with a green and blue area graph and demographic data with icons and percentage on the right.