Best Data Analytics PPT Template and Google Slides Themes

Data analytics template featuring a central magnifying glass and six surrounding icons and caption areas.
P.ID : 25759
    13 slides
    Slide deck showing data valuation methods, using colorful arrows, text boxes, and icons in a clean and modern layout.
    13 slides
    Data Scientist Responsibilities Google Slides Templates
    11 slides
    Data classification slides illustrate a circular process with four steps with different layout designs and icons.
    11 slides
    A flowchart slides illustrating the data hygiene process with steps in different layout designs accompanied by icons.
    11 slides
    Slide deck comparing the roles of data scientist and engineer, with color coded sections and clear definitions.
    11 slides
    Data scrubbing process diagram PPT slides showcasing steps with different colorful layout designs and icons.
    12 slides
    A collection of business data analysis PPT slides with colorful charts and infographics with icons on a white backdrop.
    374 views
    20 Downloads
    Get Custom Slides by Experts
    Instantly Access Templates in PowerPoint

    Data Analytics PPT Template and Google Slides Themes


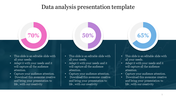
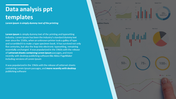
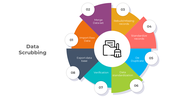
    Introducing our Data Analytics PowerPoint template! This simple design is perfect for anyone who wants to explain data clearly and interestingly. It's ideal for professionals, students, and teachers.

    What's special about it?

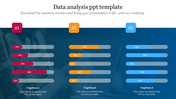
    Our template has a modern design that grabs attention and helps people understand complex information. It has a magnifying glass in the middle (like you're looking closely at the data) and blue icons on a white background. It looks professional and sophisticated.

    How can you use it?

    This slide is like a powerful tool for showing how data analysis works. You can use it to:
    • Explain trends with numbers.
    • Present findings from market research.
    • Show strategies based on data.
    • The template helps you share complicated information in a way everyone can understand.

    Who can benefit?

    This template is great for people in business, finance, marketing, or tech who want to impress with their presentations. It's also perfect for students and teachers who want to make data analysis easier to learn and discuss.

    Ready to make your data presentations awesome? Download our Data Analytics template today! Turn your data into clear insights that everyone will love.


    Features of the template

    • 100% customizable slides and easy to download.
    • Slides are available in different nodes & colors.
    • The slide contains 16:9 and 4:3 formats.
    • It is easy to change the colors of the slide quickly. 
    • Well-crafted template with an instant download facility.
    Advertisement

    You May Also Like These PowerPoint Templates

    Add to Wishlist
    Download
    AI Customize
    Data analysis slide with three sections represented by color coded icons with placeholder text.
    Add to Wishlist
    Download
    AI Customize
    Data analytics PPT slide showing four key areas from analysing data patterns to enhancing business performance.
    Add to Wishlist
    Download
    AI Customize
    Slide featuring five pentagons in yellow, pink, green, purple, and blue, representing the benefits of studying data science.
    Add to Wishlist
    Download
    AI Customize
    Data cleansing cycle PowerPoint slides with different colorful layout designs with icons and text descriptions.
    Add to Wishlist
    Download
    AI Customize
    Illustration of a man holding a laptop with data visualization, alongside three numbered text sections with green arrows.
    Add to Wishlist
    Download
    AI Customize
    Data analysis PowerPoint featuring an illustration of data charts and various slides layouts for analysis steps.
    Add to Wishlist
    Download
    AI Customize
    Data analysis template featuring a magnifying glass graphic, numbered sections, and placeholder blocks.
    Free
    Add to Wishlist
    Download
    AI Customize
    Data analysis template with two circular progress charts displaying 70% and 45% and six labeled captions with text area.
    Add to Wishlist
    Download
    AI Customize
    Slide design featuring a laptop and data storage graphics for big data analysis, listing various categories with text.
    Add to Wishlist
    Download
    AI Customize
    Informative slides about data science, highlighting colorful different layout designs and icons.
    Add to Wishlist
    Download
    AI Customize
    Circular data science application slide with ten numbered colorful boxes, arranged in a ring around a central title.
    Free
    Add to Wishlist
    Download
    AI Customize
    Colorful circular layout with grey central circle with icon, surrounding seven nodes, illustrating data cleansing steps.
    Free
    Add to Wishlist
    Download
    AI Customize
    Visual representation of data classification, featuring a laptop and labeled categories on a purple background.
    Add to Wishlist
    Download
    AI Customize
    Horizontal bar chart displaying data for five months and six regions, with four labeled icons in blue, purple, red, and teal.
    Add to Wishlist
    Download
    AI Customize
    Data analytics slide featuring laptops, tablets, charts, and graphs, with four options and icons listed below.