MILESTONE 🌟 5 Million+ creative minds trust SlideEgg! Grab 80% OFF

Data Scientist Vs Data Engineer PPT And Google Slides

Pack of 11 slides
P.ID : 71326
Advertisement
183 views
28 Downloads
Get Custom Slides by Experts
Instantly Access Templates in PowerPoint

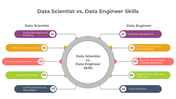
Data Scientist Vs Data Engineer Presentation Slides


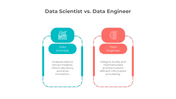
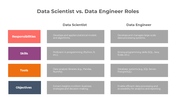
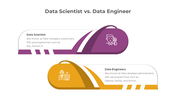
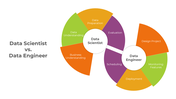
Explore the dynamic comparison between Data Science and Data Engineering roles through this insightful PowerPoint presentation. Tailored for professionals, educators, and students, it provides a comprehensive understanding of the distinctions between these pivotal roles in the data industry. This PowerPoint template is an invaluable resource for data enthusiasts, students, educators, and professionals seeking to grasp the fundamental differences between Data Science and Data Engineering. The template offers visually engaging slides, each dedicated to illustrating the unique aspects of Data Science and Data Engineering roles, aiding in clearer comprehension and practical application of these concepts. Featuring a range of visually appealing slides, enriched with graphics and content, the template succinctly presents the distinctions between Data Science and Data Engineering. All slides are fully editable, allowing seamless customization to meet specific presentation needs. As the presenter, you'll gain a comprehensive understanding of the roles and responsibilities of Data Scientists and Data Engineers, empowering you to effectively convey their significance in various professional settings. Leverage the potential of the "Data Science vs Data Engineer PowerPoint Presentation" to elevate your presentations and effectively communicate the critical distinctions between Data Science and Data Engineering.

Features of the templates:


  • 100% customizable slides and easy to download.
  • Slides are available in different nodes & colors.
  • The slide contained 16:9 and 4:3 formats.
  • Easy to change the slide colors quickly.
  • It is a well-crafted template with an instant download facility.

You May Also Like These PowerPoint Templates

Add to Wishlist
Download
AI Customize
PPT slide for data analysis template, featuring icons like a magnifying glass, coffee cup, and open book with captions.
Add to Wishlist
Download
AI Customize
Colorful data analysis PowerPoint slide with three groups of progress bars showing percentages for each section.
Add to Wishlist
Download
AI Customize
Data analysis slide with three sections represented by color coded icons with placeholder text.
Add to Wishlist
Download
AI Customize
3D cone charts in blue shades with percentage labels, showing two datasets with a legend on the right.
Add to Wishlist
Download
AI Customize
Data analytics PPT slide showing four key areas from analysing data patterns to enhancing business performance.
Add to Wishlist
Download
AI Customize
Slide featuring five pentagons in yellow, pink, green, purple, and blue, representing the benefits of studying data science.
Add to Wishlist
Download
AI Customize
Data cleansing cycle PowerPoint slides with different colorful layout designs with icons and text descriptions.
Free
Add to Wishlist
Download
AI Customize
Data Science Responsibilities PowerPoint And Google Slides
Add to Wishlist
Download
AI Customize
Data analysis PowerPoint featuring an illustration of data charts and various slides layouts for analysis steps.
Add to Wishlist
Download
AI Customize
Dark themed data dashboard with blue line and bar charts, a circular stat gauge, and numerical metrics for analysis.
Free
Add to Wishlist
Download
AI Customize
Engineer-focused slide with a figure in a yellow hard hat, flanked by green arrows denoting processes.
Free
Add to Wishlist
Download
AI Customize
Timeline template showing a journey from 2016 to 2020 with icons for research, finance, analytics, intelligence, and success.
Add to Wishlist
Download
AI Customize
Data analysis template featuring a magnifying glass graphic, numbered sections, and placeholder blocks.
Free
Add to Wishlist
Download
AI Customize
Data analysis template with two circular progress charts displaying 70% and 45% and six labeled captions with text area.
Add to Wishlist
Download
AI Customize
Informative slides about data science, highlighting colorful different layout designs and icons.
Add to Wishlist
Download
AI Customize
Circular data science application slide with ten numbered colorful boxes, arranged in a ring around a central title.
Add to Wishlist
Download
AI Customize
Wheel shaped diagram showing eight data management categories in different colors, surrounding the central label.
Free
Add to Wishlist
Download
AI Customize
Colorful circular layout with grey central circle with icon, surrounding seven nodes, illustrating data cleansing steps.
Free
Add to Wishlist
Download
AI Customize
Visual representation of data classification, featuring a laptop and labeled categories on a purple background.
Add to Wishlist
Download
AI Customize
Horizontal bar chart displaying data for five months and six regions, with four labeled icons in blue, purple, red, and teal.
Add to Wishlist
Download
AI Customize
Data analytics slide featuring laptops, tablets, charts, and graphs, with four options and icons listed below.
Add to Wishlist
Download
AI Customize
Hexagonal Flowchart of data science applications in social media, highlighting from recommendation engine upto optimization.
Add to Wishlist
Download
AI Customize
A 3D smartphone graphic showing data lines and charts, with white text on the left, set against a blue backdrop.
Add to Wishlist
Download
AI Customize
Best Data Science Template Slides Presentation
Add to Wishlist
Download
AI Customize
Support model diagram with six colorful triangles with icons showing data driven, cost efficient, and flexible strategies.
Add to Wishlist
Download
AI Customize
Data science benefits visualized in a four step process with numbered colorful tabs in pink, green, orange, and blue.
Add to Wishlist
Download
AI Customize
Collection of data analytics icons, including charts, browser windows, magnifying glasses, and statistical graphs.
Add to Wishlist
Download
AI Customize
Editable Data Mining Essentials PPT And Google Slides
Add to Wishlist
Download
AI Customize
A pack of qualitative research method slides showcasing various colorful layout designs and icons.
Add to Wishlist
Download
AI Customize
Data analytics slide with six labeled captions, each featuring a colored status indicator in green, orange, or red.
Add to Wishlist
Download
AI Customize
The data analysis slide has large text, a variety of icons above a person's silhouette, and color options at the bottom.