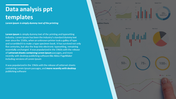
Innovative Data Analytics Icon Slides Presentation

Collection of data analytics icons, including charts, browser windows, magnifying glasses, and statistical graphs.
P.ID : 59382
    11 slides
    Data scrubbing process diagram PPT slides showcasing steps with different colorful layout designs and icons.
    12 slides
    A collection of business data analysis PPT slides with colorful charts and infographics with icons on a white backdrop.
    16 slides
    Data cleansing cycle PowerPoint slides with different colorful layout designs with icons and text descriptions.
    613 views
    124 Downloads
    Get Custom Slides by Experts
    Instantly Access Templates in PowerPoint

    Innovative Analytics Icon Slides Presentation


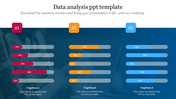
    A Data Analytics Icon template is very useful for website and blog illustrations. This set contains 12 icons that are customizable and editable for data analysis PPT. These icons are ideal for any project, from an infographic to a blog. This collection is highly versatile and can be used for any purpose. 


    About this template


    The Data Analytics Icon template is a highly flexible solution for any project. In addition, you have the option to add your own logo or other graphics to it. You can quickly customize it to your own needs. This attractive icons PPT template is a great help for improving campaigns and targeting. 


    Features of this template


    • 100 % customizable slides and easy to download. 
    • Slides are available in different nodes & colors.
    • The slide contained in 16:9 and 4:3 format.
    • It is easy to change the slide colors quickly.
    • It is a well-crafted template with an instant download facility.
    • The best PowerPoint theme template.
    • It is a well-designed presentation template.
    Advertisement

    You May Also Like These PowerPoint Templates

    Free
    Add to Wishlist
    Download
    AI Customize
    Data Science Responsibilities PowerPoint And Google Slides
    Add to Wishlist
    Download
    AI Customize
    Data analysis PowerPoint featuring an illustration of data charts and various slides layouts for analysis steps.
    Add to Wishlist
    Download
    AI Customize
    Dark themed data dashboard with blue line and bar charts, a circular stat gauge, and numerical metrics for analysis.
    Free
    Add to Wishlist
    Download
    AI Customize
    Engineer-focused slide with a figure in a yellow hard hat, flanked by green arrows denoting processes.
    Free
    Add to Wishlist
    Download
    AI Customize
    Timeline template showing a journey from 2016 to 2020 with icons for research, finance, analytics, intelligence, and success.
    Add to Wishlist
    Download
    AI Customize
    Data analysis template featuring a magnifying glass graphic, numbered sections, and placeholder blocks.
    Free
    Add to Wishlist
    Download
    AI Customize
    Data analysis template with two circular progress charts displaying 70% and 45% and six labeled captions with text area.
    Add to Wishlist
    Download
    AI Customize
    Informative slides about data science, highlighting colorful different layout designs and icons.
    Add to Wishlist
    Download
    AI Customize
    Circular data science application slide with ten numbered colorful boxes, arranged in a ring around a central title.
    Add to Wishlist
    Download
    AI Customize
    Wheel shaped diagram showing eight data management categories in different colors, surrounding the central label.
    Free
    Add to Wishlist
    Download
    AI Customize
    Colorful circular layout with grey central circle with icon, surrounding seven nodes, illustrating data cleansing steps.
    Free
    Add to Wishlist
    Download
    AI Customize
    Visual representation of data classification, featuring a laptop and labeled categories on a purple background.
    Add to Wishlist
    Download
    AI Customize
    Horizontal bar chart displaying data for five months and six regions, with four labeled icons in blue, purple, red, and teal.
    Add to Wishlist
    Download
    AI Customize
    Data analytics slide featuring laptops, tablets, charts, and graphs, with four options and icons listed below.
    Add to Wishlist
    Download
    AI Customize
    Hexagonal Flowchart of data science applications in social media, highlighting from recommendation engine upto optimization.
    Add to Wishlist
    Download
    AI Customize
    A 3D smartphone graphic showing data lines and charts, with white text on the left, set against a blue backdrop.