MILESTONE 🌟 5 Million+ creative minds trust SlideEgg! Grab 80% OFF

Benefits And Uses Of Data Science PPT And Google Slides

Data science benefits visualized in a four step process with numbered colorful tabs in pink, green, orange, and blue.
P.ID : 71354
    18 slides
    Editable Data Mining Essentials PPT And Google Slides
    13 slides
    A pack of qualitative research method slides showcasing various colorful layout designs and icons.
    11 slides
    Slide pack showing vibrant segments with colorful process diagrams, representing elements of mixed methods research.
    11 slides
    A data science slide with four colorful arrows labeled, from one to four each containing text and small descriptive icons.
    606 views
    96 Downloads
    Get Custom Slides by Experts
    Instantly Access Templates in PowerPoint

    Benefits And Uses Of Data Science Presentation Slides


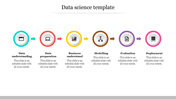
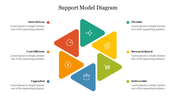
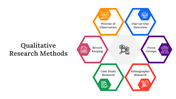
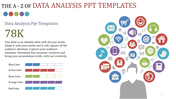
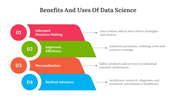
    In today's data-driven world, Data Science, a multidisciplinary field at the intersection of statistics, computer science, and domain knowledge, plays a pivotal role in extracting actionable insights from vast datasets. It empowers individuals and organizations to make informed decisions, optimize processes, and gain a competitive edge. This PowerPoint template serves as an invaluable tool for professionals, educators, and students, simplifying the presentation of the concept and advantages of Data Science. With fully editable slides and visually engaging graphics, it facilitates the creation of informative and visually appealing presentations, catering to both novice and experienced presenters. It saves time and effort while ensuring a professional and engaging result. Whether you're teaching the importance of Data Science or presenting to stakeholders, this template empowers you to convey the benefits and applications of Data Science effectively. Harness the power of Data Science and share its significance with confidence, making your presentations both informative and visually compelling. it is your content


    Features of the template:


    • 100% customizable slides and easy to download.
    • Slides are available in different nodes & colors.
    • The slide contains 16:9 and 4:3 formats.
    • Easy to change the colors of the slide quickly.
    • Highly compatible with PowerPoint and Google Slides.
    • Well-crafted template with an instant download facility.
    Advertisement

    You May Also Like These PowerPoint Templates

    Add to Wishlist
    Download
    AI Customize
    Slide comparing the roles of Data Scientists and Data Engineers, detailing their responsibilities and programming languages.
    Add to Wishlist
    Download
    AI Customize
    Awesome Data Cleansing Structure PPT And Google Slides
    Add to Wishlist
    Download
    AI Customize
    Slide showing a metrics table on the left and a bar chart with orange and white bars on a blue gradient background.
    Add to Wishlist
    Download
    AI Customize
    Circular diagram with six colored segments around a central circle, illustrating the steps of data analysis.
    Free
    Add to Wishlist
    Download
    AI Customize
    Five step data cleansing process, featuring stages represented with colorful icons.
    Add to Wishlist
    Download
    AI Customize
    Slide featuring data science, data mining, and data analysis steps with placeholder text.
    Add to Wishlist
    Download
    AI Customize
    3D data visualization with charts on a tablet and two hexagonal stats, displayed on a dark blue background.
    Add to Wishlist
    Download
    AI Customize
    Visual representation of business benefits from data science, including improved efficiency and competitive advantage.
    Add to Wishlist
    Download
    AI Customize
    Data analytics slide with a layered silhouette of a running person, numbered sections, and icons for each step.
    Add to Wishlist
    Download
    AI Customize
    Best Data Analysis PPT Slide Presentation
    Add to Wishlist
    Download
    AI Customize
    Slide featuring eight sections, each with a colored icons and text boxes arranged in two columns.
    Add to Wishlist
    Download
    AI Customize
    Three colored rectangles in orange, green, and teal, representing types of data stewards with text areas below.
    Add to Wishlist
    Download
    AI Customize
    Data analytics slide displaying a circular diagram with sections from data backup to data quality with colored icons.
    Add to Wishlist
    Download
    AI Customize
    Central magnifying glass with surrounding icons representing different data analytics elements.