Editable Data Aggregation PPT And Google Slides Template

Pack of 11 slides
P.ID : 71991
Advertisement
169 views
43 Downloads
Get Custom Slides by Experts
Instantly Access Templates in PowerPoint

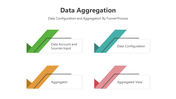
Data Aggregation PowerPoint Template


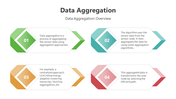
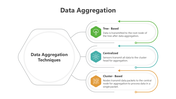
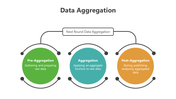
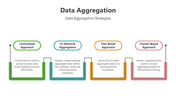
Embark on a transformative journey into the realm of data aggregation with our PowerPoint presentation template, seamlessly elucidating Strategies, Techniques, and an Overview of this crucial subject. Its fully editable format serves as a dynamic tool for conveying complex data concepts with ease, transforming intricate information into visually compelling content. Whether you're a business analyst, researcher, or educator, this template caters to a broad audience, providing benefits such as easy comprehension, retention, and adaptability for presentations across industries. Impress your audience with visually appealing presentations, ensuring your message is not only understood but also retained. Encourage your audience to download this template and elevate their data storytelling game, simplifying the complex and making data presentations unforgettable. Download now and captivate your viewers with compelling data narratives.

Features of this template


  • 100% customizable slides and easy to download.
  • The slide contains 16:9 and 4:3 formats.
  • Easy to change the colors of the slide quickly.
  • Highly compatible with PowerPoint and Google Slides.
  • Well-crafted template with an instant download facility.

You May Also Like These PowerPoint Templates

Free
Add to Wishlist
Download
AI Customize
Six hexagons in different colors encircling a central data icon, each labeled with numbers and captions.
Add to Wishlist
Download
AI Customize
A PowerPoint template outlining the responsibilities of a data scientist, featuring four key tasks in a diamond layout.
Add to Wishlist
Download
AI Customize
Three bar charts in red, blue, and green, with captions and text below each for data analysis insights.
Add to Wishlist
Download
AI Customize
Central red diamond with data chart icon, encircled by four red and white nodes forming a cross layout.
Free
Add to Wishlist
Download
AI Customize
Bar chart with five vertical bars representing data analysis with various high, low, and volume indicators displayed.
Add to Wishlist
Download
AI Customize
Data analytics slide with project progress bars from November to February, showing percentages for each month.
Add to Wishlist
Download
AI Customize
Applications of Data Science in retail marketing, including recommendation systems to inventory management with text.
Add to Wishlist
Download
AI Customize
Comparison slide with a green and blue area graph and demographic data with icons and percentage on the right.
Add to Wishlist
Download
AI Customize
Four hexagons in blue, teal, pink, and balck, each with icons and linked to a gray text box.
Add to Wishlist
Download
AI Customize
A structured chart of green bars, light and dark shades alternating, over a blue lined background with descriptive labels.
Add to Wishlist
Download
AI Customize
Line chart in green, red, and yellow with three product data columns paired with circular percentage boxes and text segments.
Add to Wishlist
Download
AI Customize
Data analytics template with a central magnifying glass and surrounding icons place with caption areas.
Add to Wishlist
Download
AI Customize
Data analysis template with a bar graph and illustrated dashboard layout with two caption areas for data.
Add to Wishlist
Download
AI Customize
Illustration of a person interacting with blue data visualization panels, with three numbered text sections on the right.
Add to Wishlist
Download
AI Customize
Illustration of essential data analytics elements in a visually connected with caption areas circular layout.
Add to Wishlist
Download
AI Customize
Banking data analysis slide with green bar chart on a computer screen and three listed issues in circles on the right.
Add to Wishlist
Download
AI Customize
Data analysis slide with a monitor showing analytics icons, and five colorful speech bubbles indicating various steps around it.
Add to Wishlist
Download
AI Customize
Slide with four icons representing Data Timeline, SSD, Data Level, and Hard Disk, with descriptions below each icon.
Add to Wishlist
Download
AI Customize
PowerPoint slide showing a bar chart with four sections with color coded bars and placeholder text.
Free
Add to Wishlist
Download
AI Customize
Stunning Data Analysis PowerPoint Templates-Four Node
Add to Wishlist
Download
AI Customize
Data analytics PowerPoint template featuring two sections with blue icons for web data and chart analysis.
Add to Wishlist
Download
AI Customize
An infographic slide illustrating the skills and responsibilities of a data scientist in a colorful circular model.
Add to Wishlist
Download
AI Customize
Effective Presentation On Data Analytics Template Slide
Add to Wishlist
Download
AI Customize
Six Node Business Data Analysis Presentation PowerPoint
Add to Wishlist
Download
AI Customize
Four colored diamond shapes with curved arrows in the center, surrounded by captions and percentage circles.
Add to Wishlist
Download
AI Customize
Central magnifying glass with a green graph, surrounded by six data related icons arranged circularly.
Add to Wishlist
Download
AI Customize
Data analytics template featuring a central magnifying glass and six surrounding icons and caption areas.
Add to Wishlist
Download
AI Customize
Best Data Analysis PPT Template free Slide