Data Analytics PowerPoint Presentation And Google Slides


 Canva
Canva
Data Analytics PowerPoint, Google Slides, and Canva Template
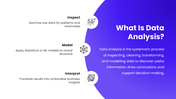
The Data Analysis PowerPoint, Google Slides, and Canva Template is designed to help you present data insights in a clear, structured, and visually engaging way. With a modern purple-themed design and clean layouts, it makes complex data easier to understand and more effective to communicate.
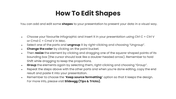
Built with fully editable slides, this template allows you to quickly update text, charts, colors, and visuals to match your data and presentation style. You can easily customize each slide without affecting the overall design, helping you save time while maintaining a professional look.
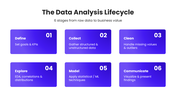
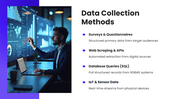
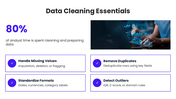
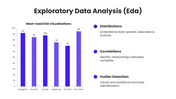
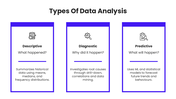
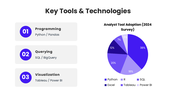
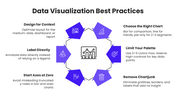
The content is organized to follow a logical flow—from understanding data analysis and its lifecycle to data collection, cleaning, exploration, and visualization. It is well-suited for data analysts, business professionals, researchers, students, and corporate teams who need to present insights in a clear and structured format.
Whether you're sharing reports, presenting findings, or explaining data-driven strategies, this template helps you communicate information with clarity and confidence. Download now and create presentations that turn data into meaningful insights.
Features of this template
- 100% customizable slides and easy to download.
- The slides contain 16:9 and 4:3 formats.
- Easy to change the colors quickly.
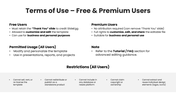
- Highly compatible with PowerPoint, Google Slides, and Canva templates.


You May Also Like These PowerPoint Templates


Showing36 of69,218 templates