Free - Data Analysis Presentation PPT Template and Google Slides
Free

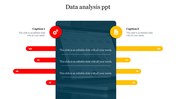
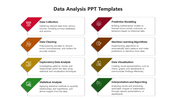

Data Analysis PPT Template For Presentation
Data analysis is the process of examining and interpreting data to identify patterns, trends, and meaningful insights. This slide offers the perfect solution for showcasing your data with stunning visual cues that make your information stand out.
About the Slide Design
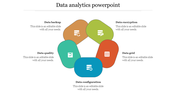
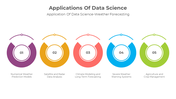
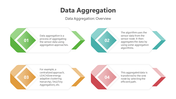
The slide features an intuitive circular design with percentage markers in vibrant red and green tones. It includes six placeholders that allow you to present your data in an organized and visually appealing manner. With this slide, you can effectively communicate your information using impactful visuals and icons.
Purpose of the Slide
This slide is essential for helping organizations make informed decisions, enhance efficiency, and remain competitive in an increasingly data-driven world.
Who Can Use It?
This slide is ideal for professionals seeking a clear and concise way to analyze and visualize their data during presentations.
Download the slide today and customize it effortlessly to meet your unique needs — for free!
Features of the Template
- 100 % customizable slides and easy to download
- This PowerPoint has six nodes.
- The slide contained 16:9 and 4:3 formats.
- It comes with a data theme.
- It is a well-crafted template with an instant download facility.
- It is designed with a stunning theme design.


You May Also Like These PowerPoint Templates
Add to Wishlist
Download
AI Customize

Add to Wishlist
Download
AI Customize

Add to Wishlist
Download
AI Customize

Add to Wishlist
Download
AI Customize

Add to Wishlist
Download
AI Customize

Free
Add to Wishlist
Download
AI Customize

Add to Wishlist
Download
AI Customize

Add to Wishlist
Download
AI Customize

Add to Wishlist
Download
AI Customize

Add to Wishlist
Download
AI Customize

Add to Wishlist
Download
AI Customize

Add to Wishlist
Download
AI Customize

Add to Wishlist
Download
AI Customize

Add to Wishlist
Download
AI Customize

Add to Wishlist
Download
AI Customize

Add to Wishlist
Download
AI Customize

Add to Wishlist
Download
AI Customize

Add to Wishlist
Download
AI Customize

Add to Wishlist
Download
AI Customize

Add to Wishlist
Download
AI Customize
