Free - Free PPT Template For Data Classification & Google Slides

Free
Visual representation of data classification, featuring a laptop and labeled categories on a purple background.
P.ID : 67335
    2.6K+ views
    686 Downloads
    Get Custom Slides by Experts
    Instantly Access Templates in PowerPoint

    Efficient Data Classification Template


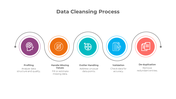
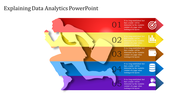
    Download this Best Free PowerPoint Template For Data Classification Template for your descriptive presentation. The template is used for presentation purposes. This template is free of cost and can be edited easily. The template is added with four highly efficient nodes. The template is added with a data design that shows the use of the presentation.


    About the template:


    This Best Free PowerPoint Template For Data Classification Template can give 100% satisfaction and make your presentation exciting. This template has user-friendly and fully customized features that you can use in the presentation. The template is added with vibrant colors, which can gain the audience's attention. This template is edited and can be changed accordingly. Make use of this template for conferences and presentations.


    Features of this Template:

    1. 100% customizable slides
    2. It is easy to download.
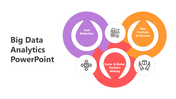
    3. Slides available in different nodes & colors.
    4. The slide contained 16:9 and 4:3 formats.
    5. Easy to change the slide colors quickly.
    6. Well-crafted template with instant download facility.
    7. Creative design with text area.

    Advertisement

    You May Also Like These PowerPoint Templates

    Free
    Add to Wishlist
    Download
    AI Customize
    Data analysis slide with a business figure illustration and bar chart, featuring four colorful captions on a dark backdrop.
    Add to Wishlist
    Download
    AI Customize
    Slides featuring an overview of data aggregation processes with numbered steps in different colorful layout designs.
    Free
    Add to Wishlist
    Download
    AI Customize
    Six hexagons in different colors encircling a central data icon, each labeled with numbers and captions.
    Add to Wishlist
    Download
    AI Customize
    A PowerPoint template outlining the responsibilities of a data scientist, featuring four key tasks in a diamond layout.
    Add to Wishlist
    Download
    AI Customize
    Three bar charts in red, blue, and green, with captions and text below each for data analysis insights.
    Add to Wishlist
    Download
    AI Customize
    A data analytics slide featuring a magnifying glass icon at the center, surrounded by sections for various analytics topics.
    Add to Wishlist
    Download
    AI Customize
    Magnifying glass in the center highlighting a chart, surrounded by six colorful analytics icons and each with caption areas.
    Add to Wishlist
    Download
    AI Customize
    Central red diamond with data chart icon, encircled by four red and white nodes forming a cross layout.
    Free
    Add to Wishlist
    Download
    AI Customize
    Bar chart with five vertical bars representing data analysis with various high, low, and volume indicators displayed.
    Add to Wishlist
    Download
    AI Customize
    Data analytics slide with project progress bars from November to February, showing percentages for each month.
    Add to Wishlist
    Download
    AI Customize
    Applications of Data Science in retail marketing, including recommendation systems to inventory management with text.
    Add to Wishlist
    Download
    AI Customize
    Comparison slide with a green and blue area graph and demographic data with icons and percentage on the right.
    Add to Wishlist
    Download
    AI Customize
    Four hexagons in blue, teal, pink, and balck, each with icons and linked to a gray text box.
    Add to Wishlist
    Download
    AI Customize
    A structured chart of green bars, light and dark shades alternating, over a blue lined background with descriptive labels.
    Add to Wishlist
    Download
    AI Customize
    Data analytics layout featuring a central gray magnifying glass and three orange icons linked to labeled sections.
    Add to Wishlist
    Download
    AI Customize
    Line chart in green, red, and yellow with three product data columns paired with circular percentage boxes and text segments.
    Add to Wishlist
    Download
    AI Customize
    Illustration of a magnifying glass in gray with red icon and two text elements, highlighting data analysis themes.