Easy To Use Data Analytics PPT Template and Google Slides

Data analytics PPT slide showing four key areas from analysing data patterns to enhancing business performance.
P.ID : 24601
    857 views
    70 Downloads
    Get Custom Slides by Experts
    Instantly Access Templates in PowerPoint

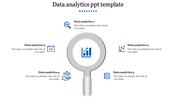
    Creative Data Analytics PowerPoint Template 


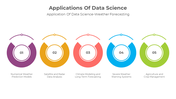
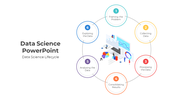
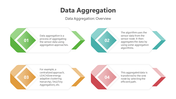
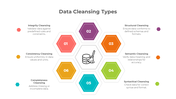
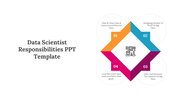
    Embark on the transformative journey of Data Analytics, a vital process revolutionizing how we glean insights from data. In a rapidly evolving digital landscape, Data Analytics is the key to unlocking meaningful patterns and trends, empowering individuals and businesses to make informed decisions. Dive into a world where raw data is transformed into actionable intelligence, propelling innovation and efficiency. Introducing a user-friendly PowerPoint template with a captivating blue color theme, designed for professionals across industries. All slides are fully editable, providing a seamless experience for tech enthusiasts, corporate executives, and anyone looking to convey ideas effectively. This versatile template enhances presentations, allowing users to showcase data trends and strategies with clarity. The benefits extend to increased confidence and audience engagement. Encourage your peers to leverage the potential of this template, turning every slide into a powerful tool for impactful communication. Elevate your presentations with the seamless blend of insightful content and visually appealing design.

    Features of this template


    • 100% customizable slides and easy to download.
    • Slides are available in different nodes & colors.
    • The slide contains 16:9 and 4:3 formats.
    • Easy to change the colors of the slide quickly.
    • Highly compatible with PowerPoint and Google Slides.
    • Well-crafted template with an instant download facility.
    Advertisement

    You May Also Like These PowerPoint Templates

    Add to Wishlist
    Download
    AI Customize
    Three bar charts in red, blue, and green, with captions and text below each for data analysis insights.
    Add to Wishlist
    Download
    AI Customize
    Data analytics slide with project progress bars from November to February, showing percentages for each month.
    Add to Wishlist
    Download
    AI Customize
    Applications of Data Science in retail marketing, including recommendation systems to inventory management with text.
    Add to Wishlist
    Download
    AI Customize
    Comparison slide with a green and blue area graph and demographic data with icons and percentage on the right.
    Add to Wishlist
    Download
    AI Customize
    Four hexagons in blue, teal, pink, and balck, each with icons and linked to a gray text box.
    Add to Wishlist
    Download
    AI Customize
    A structured chart of green bars, light and dark shades alternating, over a blue lined background with descriptive labels.
    Add to Wishlist
    Download
    AI Customize
    Line chart in green, red, and yellow with three product data columns paired with circular percentage boxes and text segments.
    Add to Wishlist
    Download
    AI Customize
    Data analytics template with a central magnifying glass and surrounding icons place with caption areas.
    Add to Wishlist
    Download
    AI Customize
    Illustration of a person interacting with blue data visualization panels, with three numbered text sections on the right.
    Add to Wishlist
    Download
    AI Customize
    Illustration of essential data analytics elements in a visually connected with caption areas circular layout.
    Add to Wishlist
    Download
    AI Customize
    PowerPoint slide showing a bar chart with four sections with color coded bars and placeholder text.
    Free
    Add to Wishlist
    Download
    AI Customize
    Stunning Data Analysis PowerPoint Templates-Four Node
    Add to Wishlist
    Download
    AI Customize
    Data analytics PowerPoint template featuring two sections with blue icons for web data and chart analysis.
    Add to Wishlist
    Download
    AI Customize
    An infographic slide illustrating the skills and responsibilities of a data scientist in a colorful circular model.
    Add to Wishlist
    Download
    AI Customize
    Effective Presentation On Data Analytics Template Slide