Lens Data Analytics PPT Template Presentation - Yellow Slide

Gray magnifying glass illustration with three yellow icons representing data analytics concepts on a white background.
P.ID : 25797
    174 views
    7 Downloads
    Get Custom Slides by Experts
    Instantly Access Templates in PowerPoint

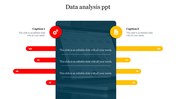
    Customizable Magnifying Lens Data Analytics PPT Template 


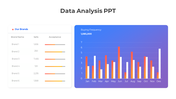
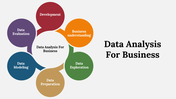
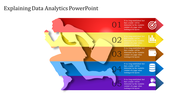
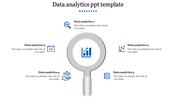
    Using a data analytics ppt template, you can deliver a massive data analytical presentation. This template is exclusively designed for business, marketing, and sales fields. The unique color of the template makes the audience more interactive with your presentation. The magnifying glass graphical image in this template looks very impressive. Here some professional icons are used to deliver consistent information to the audience. You can analyze your data and add it to this presentation so that you can deliver a straightforward presentation. You can customize these template icons and design as you want, and also you can easily monitor the growth of your business using this data analytics template. Download this professional data analytics ppt template for brief analysis and study over your collective data of various stages and various periods of your business.


    Features of this template:


    • 100 % customizable slides and easy to download. 
    • Slides available in different nodes & colors.
    • The slide contained in 16:9 and 4:3 format.
    • Easy to change the slide colors quickly.
    • Well-crafted template with instant download facility.
    • The clear layout of this template will help you to design a professional-looking presentation.
    • The multi-color visuals of this slide will make your presentation eye-catching.
    Advertisement

    You May Also Like These PowerPoint Templates

    Add to Wishlist
    Download
    AI Customize
    Environmental data slide with a bar chart displaying statistics for humans, trees, animals, and water with placeholder text.
    Free
    Add to Wishlist
    Download
    AI Customize
    Data analysis slide with a business figure illustration and bar chart, featuring four colorful captions on a dark backdrop.
    Add to Wishlist
    Download
    AI Customize
    Slides featuring an overview of data aggregation processes with numbered steps in different colorful layout designs.
    Free
    Add to Wishlist
    Download
    AI Customize
    Six hexagons in different colors encircling a central data icon, each labeled with numbers and captions.
    Add to Wishlist
    Download
    AI Customize
    A PowerPoint template outlining the responsibilities of a data scientist, featuring four key tasks in a diamond layout.
    Add to Wishlist
    Download
    AI Customize
    Three bar charts in red, blue, and green, with captions and text below each for data analysis insights.
    Add to Wishlist
    Download
    AI Customize
    Data analytics slide with project progress bars from November to February, showing percentages for each month.
    Add to Wishlist
    Download
    AI Customize
    Applications of Data Science in retail marketing, including recommendation systems to inventory management with text.
    Add to Wishlist
    Download
    AI Customize
    Comparison slide with a green and blue area graph and demographic data with icons and percentage on the right.
    Add to Wishlist
    Download
    AI Customize
    Four hexagons in blue, teal, pink, and balck, each with icons and linked to a gray text box.
    Add to Wishlist
    Download
    AI Customize
    A structured chart of green bars, light and dark shades alternating, over a blue lined background with descriptive labels.
    Add to Wishlist
    Download
    AI Customize
    Line chart in green, red, and yellow with three product data columns paired with circular percentage boxes and text segments.
    Add to Wishlist
    Download
    AI Customize
    Data analytics template with a central magnifying glass and surrounding icons place with caption areas.
    Add to Wishlist
    Download
    AI Customize
    Illustration of a person interacting with blue data visualization panels, with three numbered text sections on the right.
    Add to Wishlist
    Download
    AI Customize
    Illustration of essential data analytics elements in a visually connected with caption areas circular layout.
    Add to Wishlist
    Download
    AI Customize
    PowerPoint slide showing a bar chart with four sections with color coded bars and placeholder text.