Data Analysis PowerPoint Template with Chart

Three bar charts in red, blue, and green, with captions and text below each for data analysis insights.
P.ID : 47849
    11 slides
    Data scrubbing process diagram PPT slides showcasing steps with different colorful layout designs and icons.
    12 slides
    A collection of business data analysis PPT slides with colorful charts and infographics with icons on a white backdrop.
    16 slides
    Data cleansing cycle PowerPoint slides with different colorful layout designs with icons and text descriptions.
    13 slides
    Data analysis PowerPoint featuring an illustration of data charts and various slides layouts for analysis steps.
    324 views
    47 Downloads
    Get Custom Slides by Experts
    Instantly Access Templates in PowerPoint

    Data Analysis Chart Presentation Slide

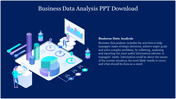
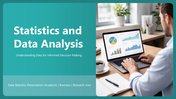
    Data analysis is a process that involves collecting, cleaning, processing, and analyzing large sets of data using statistical and machine learning algorithms. The goal is to identify patterns, relationships, and meaningful insights that can be used to inform business decisions, identify opportunities for improvement, and develop growth strategies. Data analysis plays a critical role in fields such as finance, marketing, healthcare, and technology, where vast amounts of data are collected and analyzed on a regular basis. It helps organizations understand their customers, optimize their operations, and stay competitive in an increasingly data-driven world.Data analysis toolkit a comprehensive template for streamlining data analysis processes.

    Features of the template

    • 100% customizable slides and easy to download.
    • The slide contained 16:9 and 4:3 formats.
    • It is a well-crafted template with an instant download facility.
    • Mind-blowing slide for the PowerPoint.
    • Best presentation slide.
    Advertisement

    You May Also Like These PowerPoint Templates

    Add to Wishlist
    Download
    AI Customize
    Data analysis template featuring a magnifying glass graphic, numbered sections, and placeholder blocks.
    Free
    Add to Wishlist
    Download
    AI Customize
    Data analysis template with two circular progress charts displaying 70% and 45% and six labeled captions with text area.
    Add to Wishlist
    Download
    AI Customize
    Informative slides about data science, highlighting colorful different layout designs and icons.
    Add to Wishlist
    Download
    AI Customize
    Circular data science application slide with ten numbered colorful boxes, arranged in a ring around a central title.
    Free
    Add to Wishlist
    Download
    AI Customize
    Colorful circular layout with grey central circle with icon, surrounding seven nodes, illustrating data cleansing steps.
    Free
    Add to Wishlist
    Download
    AI Customize
    Visual representation of data classification, featuring a laptop and labeled categories on a purple background.
    Add to Wishlist
    Download
    AI Customize
    Horizontal bar chart displaying data for five months and six regions, with four labeled icons in blue, purple, red, and teal.
    Add to Wishlist
    Download
    AI Customize
    Data analytics slide featuring laptops, tablets, charts, and graphs, with four options and icons listed below.
    Add to Wishlist
    Download
    AI Customize
    Hexagonal Flowchart of data science applications in social media, highlighting from recommendation engine upto optimization.
    Add to Wishlist
    Download
    AI Customize
    A 3D smartphone graphic showing data lines and charts, with white text on the left, set against a blue backdrop.
    Add to Wishlist
    Download
    AI Customize
    Support model diagram with six colorful triangles with icons showing data driven, cost efficient, and flexible strategies.
    Add to Wishlist
    Download
    AI Customize
    Pack of slide showcasing data collection methods with icons in different colors on a white backdrop.
    Add to Wishlist
    Download
    AI Customize
    Data science benefits visualized in a four step process with numbered colorful tabs in pink, green, orange, and blue.
    Add to Wishlist
    Download
    AI Customize
    Collection of data analytics icons, including charts, browser windows, magnifying glasses, and statistical graphs.
    Add to Wishlist
    Download
    AI Customize
    Editable Data Mining Essentials PPT And Google Slides
    Add to Wishlist
    Download
    AI Customize
    A pack of qualitative research method slides showcasing various colorful layout designs and icons.