100% Editable Data Analytics PPT Template - Four Icons


Data Analytics PowerPoint Template for Presentation
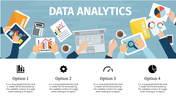
Are you ready to take your data analytics presentations to the next level? Dive into our data analytics PPT template—a must-have for analysts, data scientists, and professionals seeking to communicate insights with flair.
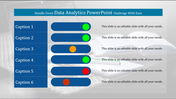
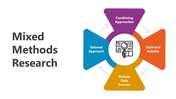
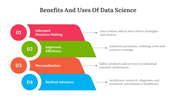
This template features four circles with a vibrant color scheme of red, orange, purple, and gradient, enhancing the visual appeal. Each circle has an icon representing key aspects of data analytics, accompanied by four text areas for detailed annotations.
Perfect for business analysts, researchers, and decision-makers, this template streamlines the process of conveying complex data concepts. Are you ready to make your data speak volumes? Click now to access the data analytics PowerPoint slides, where visualization meets precision. Elevate your presentations, engage your audience, and showcase your data prowess with confidence. Your journey to impactful data analytics starts here!
Features of the template
- 100% customizable slides are easy to download.
- Slides are available in different colors.
- The slide has 4:3 and 16:9 formats.
- It is easy to change the slide colors quickly.
- It has a cute design to impress an audience.
- Create feature-rich, animated presentations.


You May Also Like These PowerPoint Templates
Add to Wishlist
Download
AI Customize

Add to Wishlist
Download
AI Customize

Add to Wishlist
Download
AI Customize

Add to Wishlist
Download
AI Customize

Add to Wishlist
Download
AI Customize

Add to Wishlist
Download
AI Customize

Add to Wishlist
Download
AI Customize

Add to Wishlist
Download
AI Customize

Add to Wishlist
Download
AI Customize

Add to Wishlist
Download
AI Customize

Add to Wishlist
Download
AI Customize

Add to Wishlist
Download
AI Customize

Add to Wishlist
Download
AI Customize

Add to Wishlist
Download
AI Customize

Add to Wishlist
Download
AI Customize

Add to Wishlist
Download
AI Customize

Add to Wishlist
Download
AI Customize

Add to Wishlist
Download
AI Customize

Add to Wishlist
Download
AI Customize

Add to Wishlist
Download
AI Customize
