Data Scientist Vs Data Engineer Roles PPT And Google Slides

Data Scientist Vs Data Engineer Roles PPT And Google Slides
P.ID : 71329
    16 slides
    Collection of slides detailing data analysis techniques, with colorful numbered blocks and varied infographic designs.
    11 slides
    Data quality management slides with different colorful layout designs and text descriptions.
    13 slides
    Big data analytics slide deck with colorful charts, showcasing types, benefits, and decision making aids.
    136 views
    16 Downloads
    Get Custom Slides by Experts
    Instantly Access Templates in PowerPoint

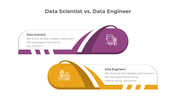
    Data Scientist Vs Data Engineer Roles Presentation Slides


    Explore a comprehensive exploration of the distinctions between Data Scientist and Data Engineer roles with this meticulously designed PowerPoint presentation. Tailored for professionals, educators, and students in the data industry, it provides a detailed analysis of the key responsibilities and skills that define each role. Delve into the unique aspects of Data Science and Data Engineering, gaining valuable insights into how these roles contribute to the data ecosystem. It serves as an informative tool for anyone looking to navigate the dynamic field of data analytics and engineering. The template features visually engaging slides, each meticulously designed to elucidate the distinct responsibilities of Data Scientists and Data Engineers. This aids in clearer comprehension and practical application of these roles in real-world scenarios. With a range of visually appealing slides, enriched with graphics and content, the template succinctly presents the key distinctions between Data Scientist and Data Engineer roles. Every slide is fully editable, ensuring seamless customization to cater to specific presentation needs. This equips you to effectively communicate their significance in various professional settings. Leverage the potential of the "Data Scientist Vs Data Engineer Roles PowerPoint Presentation" to elevate your presentations.

    Features of the templates:


    • 100% customizable slides and easy to download.
    • Slides are available in different nodes & colors.
    • The slide contained 16:9 and 4:3 formats.
    • Easy to change the slide colors quickly.
    • It is a well-crafted template with an instant download facility.
    Advertisement

    You May Also Like These PowerPoint Templates

    Add to Wishlist
    Download
    AI Customize
    Slide featuring eight sections, each with a colored icons and text boxes arranged in two columns.
    Add to Wishlist
    Download
    AI Customize
    Three colored rectangles in orange, green, and teal, representing types of data stewards with text areas below.
    Add to Wishlist
    Download
    AI Customize
    Data analytics slide displaying a circular diagram with sections from data backup to data quality with colored icons.
    Add to Wishlist
    Download
    AI Customize
    Central magnifying glass with surrounding icons representing different data analytics elements.
    Add to Wishlist
    Download
    AI Customize
    Environmental data slide with a bar chart displaying statistics for humans, trees, animals, and water with placeholder text.
    Free
    Add to Wishlist
    Download
    AI Customize
    Data analysis slide with a business figure illustration and bar chart, featuring four colorful captions on a dark backdrop.
    Add to Wishlist
    Download
    AI Customize
    Slides featuring an overview of data aggregation processes with numbered steps in different colorful layout designs.
    Free
    Add to Wishlist
    Download
    AI Customize
    Six hexagons in different colors encircling a central data icon, each labeled with numbers and captions.
    Add to Wishlist
    Download
    AI Customize
    A PowerPoint template outlining the responsibilities of a data scientist, featuring four key tasks in a diamond layout.
    Add to Wishlist
    Download
    AI Customize
    Three bar charts in red, blue, and green, with captions and text below each for data analysis insights.
    Add to Wishlist
    Download
    AI Customize
    A data analytics slide featuring a magnifying glass icon at the center, surrounded by sections for various analytics topics.
    Add to Wishlist
    Download
    AI Customize
    Magnifying glass in the center highlighting a chart, surrounded by six colorful analytics icons and each with caption areas.
    Add to Wishlist
    Download
    AI Customize
    Central red diamond with data chart icon, encircled by four red and white nodes forming a cross layout.
    Free
    Add to Wishlist
    Download
    AI Customize
    Bar chart with five vertical bars representing data analysis with various high, low, and volume indicators displayed.
    Add to Wishlist
    Download
    AI Customize
    Data analytics slide with project progress bars from November to February, showing percentages for each month.