Big Data Analytics PowerPoint And Google Slides Templates

Pack of 13 slides
P.ID : 71541
Advertisement
559 views
99 Downloads
Get Custom Slides by Experts
Instantly Access Templates in PowerPoint

Big Data Analytics Presentation Slides


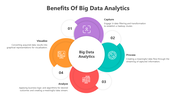
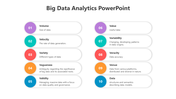
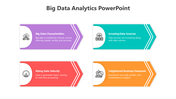
Big Data Analytics is a transformative process of examining vast and complex datasets to extract valuable insights, patterns, and trends. It involves using advanced algorithms, statistical techniques, and machine learning to analyze data from various sources, such as social media, sensors, and transaction records. By doing so, organizations can make informed decisions, improve operations, enhance customer experiences, and gain a competitive edge. Big Data empowers businesses to identify opportunities, mitigate risks, and optimize their strategies. In today's data-driven world, harnessing the power of big data is essential for innovation and growth. Our big data analytics tools templates is an invaluable resource for professionals in data science, business intelligence, and analytics fields. This template streamlines the creation of visually appealing and informative presentations on big data concepts, methods, and applications. With fully editable slides, users can easily customize content, insert data visualizations, and illustrate key analytics techniques. The templates provides a structured framework to explain the significance of big data analytics, showcase case studies, and present data-driven insights. By utilizing this template, you can effectively communicate complex analytics concepts to diverse audiences, whether in boardrooms or classrooms. It's a tool that empowers presenters to demystify big data and inspire others to harness its potential for better decision-making and innovation.

Features of the templates:


  • 100% customizable slides and easy to download.
  • Slides are available in different nodes & colors.
  • The slide contained 16:9 and 4:3 formats.
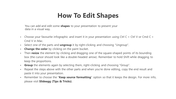
  • Easy to change the slide colors quickly.
  • It is a well-crafted template with an instant download facility.

You May Also Like These PowerPoint Templates

Add to Wishlist
Download
AI Customize
Data analytics slide with project progress bars from November to February, showing percentages for each month.
Add to Wishlist
Download
AI Customize
Applications of Data Science in retail marketing, including recommendation systems to inventory management with text.
Add to Wishlist
Download
AI Customize
Comparison slide with a green and blue area graph and demographic data with icons and percentage on the right.
Add to Wishlist
Download
AI Customize
Four hexagons in blue, teal, pink, and balck, each with icons and linked to a gray text box.
Add to Wishlist
Download
AI Customize
A structured chart of green bars, light and dark shades alternating, over a blue lined background with descriptive labels.
Add to Wishlist
Download
AI Customize
Line chart in green, red, and yellow with three product data columns paired with circular percentage boxes and text segments.
Add to Wishlist
Download
AI Customize
Data analytics template with a central magnifying glass and surrounding icons place with caption areas.
Add to Wishlist
Download
AI Customize
Data analysis template with a bar graph and illustrated dashboard layout with two caption areas for data.
Add to Wishlist
Download
AI Customize
Illustration of a person interacting with blue data visualization panels, with three numbered text sections on the right.
Add to Wishlist
Download
AI Customize
Illustration of essential data analytics elements in a visually connected with caption areas circular layout.
Add to Wishlist
Download
AI Customize
Banking data analysis slide with green bar chart on a computer screen and three listed issues in circles on the right.
Add to Wishlist
Download
AI Customize
Data analysis slide with a monitor showing analytics icons, and five colorful speech bubbles indicating various steps around it.
Add to Wishlist
Download
AI Customize
Slide with four icons representing Data Timeline, SSD, Data Level, and Hard Disk, with descriptions below each icon.
Add to Wishlist
Download
AI Customize
PowerPoint slide showing a bar chart with four sections with color coded bars and placeholder text.
Free
Add to Wishlist
Download
AI Customize
Stunning Data Analysis PowerPoint Templates-Four Node
Add to Wishlist
Download
AI Customize
Data analytics PowerPoint template featuring two sections with blue icons for web data and chart analysis.
Add to Wishlist
Download
AI Customize
An infographic slide illustrating the skills and responsibilities of a data scientist in a colorful circular model.
Add to Wishlist
Download
AI Customize
Effective Presentation On Data Analytics Template Slide
Add to Wishlist
Download
AI Customize
Six Node Business Data Analysis Presentation PowerPoint
Add to Wishlist
Download
AI Customize
Four colored diamond shapes with curved arrows in the center, surrounded by captions and percentage circles.
Add to Wishlist
Download
AI Customize
Central magnifying glass with a green graph, surrounded by six data related icons arranged circularly.
Add to Wishlist
Download
AI Customize
Data analytics template featuring a central magnifying glass and six surrounding icons and caption areas.
Add to Wishlist
Download
AI Customize
Best Data Analysis PPT Template free Slide
Add to Wishlist
Download
AI Customize
Best Data Cleansing Infographics PPT And Google Slides
Add to Wishlist
Download
AI Customize
Easily Use Data Migration PPT And Google Slides Templates
Add to Wishlist
Download
AI Customize
Slide deck showing data valuation methods, using colorful arrows, text boxes, and icons in a clean and modern layout.
Add to Wishlist
Download
AI Customize
Data Scientist Responsibilities Google Slides Templates
Add to Wishlist
Download
AI Customize
Data classification slides illustrate a circular process with four steps with different layout designs and icons.
Add to Wishlist
Download
AI Customize
A visual diagram explaining the key responsibilities of a data scientist in color coded arrows on a white backdrop.
Add to Wishlist
Download
AI Customize
A flowchart slides illustrating the data hygiene process with steps in different layout designs accompanied by icons.