Data Analysis PPT Templates & Google Slides Designs

Data analysis slide with a monitor showing analytics icons, and five colorful speech bubbles indicating various steps around it.
P.ID : 4261
    1.9K+ views
    131 Downloads
    Get Custom Slides by Experts
    Instantly Access Templates in PowerPoint

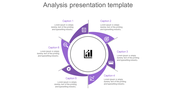
    Data Analysis Presentation Slide


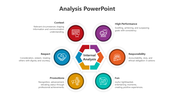
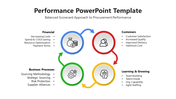
    Data analysis is the process of inspecting, cleaning, transforming, and modeling data with the goal of discovering useful information, drawing conclusions, and supporting decision-making. It involves using statistical and computational methods to explore and understand patterns, relationships, and trends within datasets. Data analysis is used in a wide range of fields, including business, science, engineering, and social sciences, to derive insights and inform decisions. It requires expertise in data management, statistics, and programming, and relies on tools and technologies like spreadsheets, databases, and specialized software.  This template can help you enhance the message with our visually engaging template, leaving a lasting impression on your audience.

    Features of the template:

    • 100% Customizable slide and easy to download
    • This template has a step by step theme
    • Drag and drop image placeholder
    • Huge Collections of slide to impress your audience
    • It supports an aspect ratio of 4:3 and 16:9 format
    • Easy to change the slide colors quickly.
    • Highly compatible with PowerPoint and Google Slides
    Advertisement

    You May Also Like These PowerPoint Templates

    Add to Wishlist
    Download
    AI Customize
    Business growth analysis slide featuring a cartoon character with a telescope showing a bar chart, and four captions.
    Add to Wishlist
    Download
    AI Customize
    Situation analysis PPT slide featuring icons for industry research and firm capabilities with captions in two colored boxes.
    Add to Wishlist
    Download
    AI Customize
    Innovative Current Situation PowerPoint And Google Slides
    Add to Wishlist
    Download
    AI Customize
    Pack of slides with colorful icons and sections for various data analysis, including visuals and layouts.
    Free
    Add to Wishlist
    Download
    AI Customize
    Analysis PowerPoint slide featuring a bar graph and vehicle icons with placeholders for text and subheadings.
    Free
    Add to Wishlist
    Download
    AI Customize
    Analysis slide with six segmented circular progress charts in gray and orange, each linked by gray bars and labeled below.
    Free
    Add to Wishlist
    Download
    AI Customize
    Analysis PowerPoint slide showcasing a target with an arrow, a chart, and a message box with caption text.
    Add to Wishlist
    Download
    AI Customize
    Performance slide with four quadrants in red, green, teal, and blue, connected in a circular flow with relevant text.
    Free
    Add to Wishlist
    Download
    AI Customize
    Grayscale process flow diagram with three horizontal arrows, numbered 01 to 03, showing analysis steps.
    Free
    Add to Wishlist
    Download
    AI Customize
    Creative word cloud in a circular layout highlighting key terms such as statistical, business, and analysis.
    Free
    Add to Wishlist
    Download
    AI Customize
    Free Slide Layouts PowerPoint Template For Business
    Free
    Add to Wishlist
    Download
    AI Customize
    Dark background slide featuring a yellow, green, red, and blue pinwheel shape surrounded by captions with percentages.
    Add to Wishlist
    Download
    AI Customize
    Business analysis slide with four colorful diamonds blue, red, green, and teal, each with percentage values.
    Free
    Add to Wishlist
    Download
    AI Customize
    Analysis presentation template with six sections arranged in an orange circle, each featuring an icon and caption.
    Add to Wishlist
    Download
    AI Customize
    Colorful infographic PPT slide illustrating five types of analysis literary, market, data, financial, and business analysis.
    Free
    Add to Wishlist
    Download
    AI Customize
    Marketing analysis PowerPoint template featuring a chart on an easel and four captions with visuals.
    Add to Wishlist
    Download
    AI Customize
    Slide for production counts analysis with a line graph showing quantity scores over multiple sessions and data indicators.
    Free
    Add to Wishlist
    Download
    AI Customize
    Red circular analysis infographic with six labeled segments, and descriptions around a central data icon.
    Free
    Add to Wishlist
    Download
    AI Customize
    Business analytics template with four orange tilted panels, each featuring an icon, caption, and description.