Free - We have the Best Collection of Analysis PowerPoint Template
Free

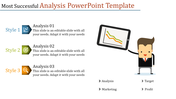
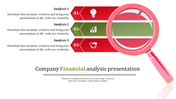
How to Create an Effective Data Analysis Presentation
In the fast-paced world of commerce, data is more than just statistics; it’s a heartbeat in decision-making. That’s where our carefully crafted “Analysis PowerPoint” template comes into play.
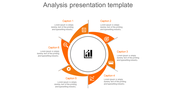
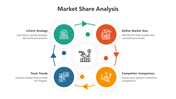
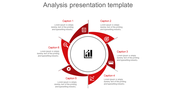
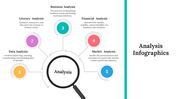
- Bull's Purpose: The symbol with an arrow in the bull's eye in the center of the mind represents perfection. Whether you’re analyzing market trends, consumer behavior, or economic projections, it’s important to hit the mark.
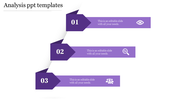
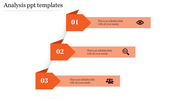
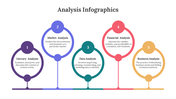
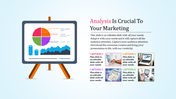
- Graphics: Beautiful and purposeful graphics tell a story. It’s not just about data points it is about trends, development, and research. Customize the graph to reflect your specific analysis.
- Color contrast: Visual appearance is important. The bold colors ensure that important points jump off the slide. You won’t have to maintain lowercase letters anymore—your audience will thank you.
Whether you’re a marketing professional, financial analyst, or project manager, these templates simplify your data presentation. Make clients, colleagues, or stakeholders happy clearly and professionally. Click below to explore our reviews and Google Slides themes.
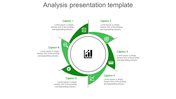
Features of the template:
- Slides are available in 4:3 & 16:9
- Well-crafted template with instant download.
- Get slides that are 100% customizable and easy to download


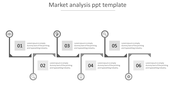
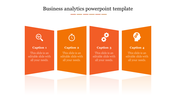
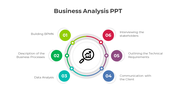
You May Also Like These PowerPoint Templates
Add to Wishlist
Download
Edit


Add to Wishlist
Download
Edit

Add to Wishlist
Download
Edit


Free
Add to Wishlist
Download
Edit

Add to Wishlist
Download
Edit

Add to Wishlist
Download
Edit

Add to Wishlist
Download
Edit

Add to Wishlist
Download
Edit

Add to Wishlist
Download
Edit

Add to Wishlist
Download
Edit

Add to Wishlist
Download
Edit


Add to Wishlist
Download
Edit


Add to Wishlist
Download
Edit

Add to Wishlist
Download
Edit

Add to Wishlist
Download
Edit
