Stunning Analysis PowerPoint Template Presentation

Businessman holding a tablet with a downward trend chart, showcasing an analysis PowerPoint template with style options.
P.ID : 14435
    544 views
    33 Downloads
    Get Custom Slides by Experts
    Instantly Access Templates in PowerPoint

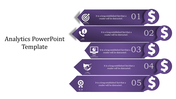
    Master Data Insight: Analysis PowerPoint & Google Slides Deck 


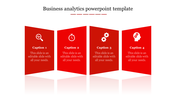
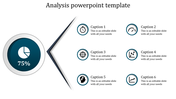
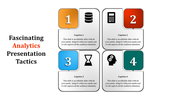
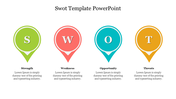
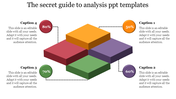
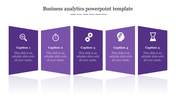
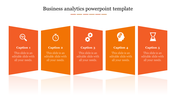
    Empower your data analysis journey with our sleek Analysis PowerPoint Template and Google Slides Themes! Featuring three flexible caption sections, this template is perfect for professionals and educators seeking clarity in presentations. Crafted for analysts and strategists, it transforms complex data into compelling stories effortlessly. Elevate your presentations and make an impact today!

    Features of the Template

    • 100 % customizable slides.
    • The slide show is in 4:3, 16:9, zip format.
    • There is powerful connectivity with Google Slides and PowerPoint.
    • It is simple and quick to alter the slide's color.
    • An efficient template that can be easily accessed immediately.
    • A well-crafted template with an instant download facility
    Advertisement

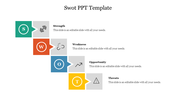
    You May Also Like These PowerPoint Templates

    Add to Wishlist
    Download
    AI Customize
    Infographic illustrating SWOT analysis with colour coded quadrants, each with distinct colors and icons.
    Free
    Add to Wishlist
    Download
    AI Customize
    Circular layout with arrows connecting blocks for SWOT elements in orange, green, beige, and red.
    Free
    Add to Wishlist
    Download
    AI Customize
    Engineer-focused slide with a figure in a yellow hard hat, flanked by green arrows denoting processes.
    Add to Wishlist
    Download
    AI Customize
    Four column SWOT template featuring blue, red, green, and yellow boxes, each with icons and text placeholders.
    Free
    Add to Wishlist
    Download
    AI Customize
    PowerPoint template with three steps for analysis, featuring eye, magnifying glass, user icons, and yellow arrow design.
    Free
    Add to Wishlist
    Download
    AI Customize
    Interactive SWOT diagram featuring yellow, blue, red, and brown arrows highlighting key factors.
    Free
    Add to Wishlist
    Download
    AI Customize
    Timeline template showing a journey from 2016 to 2020 with icons for research, finance, analytics, intelligence, and success.
    Add to Wishlist
    Download
    AI Customize
    Results template showing research and analysis steps, with visual data on men and women in a company showings their earnings.
    Add to Wishlist
    Download
    AI Customize
    Business analysis bar chart slide with six colored bars representing different activities and percentages with text area.
    Add to Wishlist
    Download
    AI Customize
    Pack of slides with colored circles and nodes in various layouts depicting stages of quality assurance in vibrant colors.
    Add to Wishlist
    Download
    AI Customize
    A pack of slides with a colorful SCQA framework illustrating icons with visual charts and layouts.
    Add to Wishlist
    Download
    AI Customize
    The thematic analysis slide diagram shows the process from qualitative data to codes and themes in three colors.
    Add to Wishlist
    Download
    AI Customize
    Analysis PowerPoint Presentation And Google Slides Themes
    Free
    Add to Wishlist
    Download
    AI Customize
    Analysis template with three blue arrows labeled 01, 02, and 03, each containing placeholder text areas.
    Free
    Add to Wishlist
    Download
    AI Customize
    Download Financial Analysis PowerPoint Presentation
    Add to Wishlist
    Download
    AI Customize
    Dupont analysis overview slides illustrating the calculation of profit margin with different layout designs with icons.
    Add to Wishlist
    Download
    AI Customize
    Current state analysis slide comparing cost reduction and value creation strategies with two colored boxes and text caption.
    Add to Wishlist
    Download
    AI Customize
    An infographic showing three stages of a research paradigm in red, orange and green in hexagon shape each with icons.