Free - Six Node Analysis PPT Templates Presentation

Free
Silhouette of a businessman at the center, connected to six colorful caption boxes with numbered steps on both sides.
P.ID : 6722
    1.4K+ views
    354 Downloads
    Get Custom Slides by Experts
    Instantly Access Templates in PowerPoint

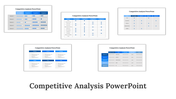
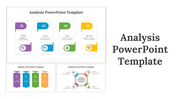
    Analysis of PPT Templates and Google Slides

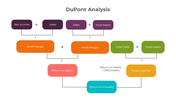
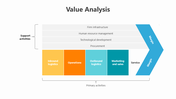
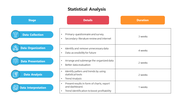
    Embark on a journey of strategic mastery with our game-changing strategy analysis templates. Designed to unlock the hidden potential within your business, these templates are the compass to navigate through complexities and unveil winning strategies. With their insightful frameworks and powerful analytical tools, our templates empower you to dissect data, identify trends, and make informed decisions. From competitive landscapes to market dynamics, our strategy analysis templates provide a holistic approach to unraveling opportunities and driving growth. Embrace innovation, outsmart your rivals, and conquer the business battlefield with our exceptional strategy analysis templates.

    Features of the template

    • 100% customizable slides and easy to download.
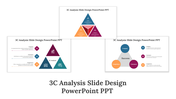
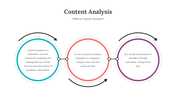
    • Slides are available in different nodes & colors.
    • The slide contains 16:9 and 4:3 formats.
    • Easy to change the colors of the slides quickly.
    • Well-crafted template with an instant download facility.
    • Highly compatible with PowerPoint and Google Slides.
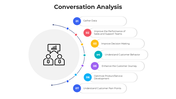
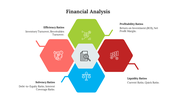
    • silhouette design with small icons. 
    Advertisement

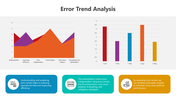
    You May Also Like These PowerPoint Templates

    Add to Wishlist
    Download
    AI Customize
    Root cause analysis slide with a tree diagram and four labeled colored boxes on branches, with three captions at the bottom.
    Add to Wishlist
    Download
    AI Customize
    Circular infographic with a central globe icon connected to eight color-coded nodes for analytics techniques.
    Free
    Add to Wishlist
    Download
    AI Customize
    Colorful radial design with six segments around a red analysis icon, highlighting key analytics strategies.
    Add to Wishlist
    Download
    AI Customize
    Five colorful oval shapes in blue, green, red, orange, and teal, with shadow effects, featuring icons and captions inside.
    Add to Wishlist
    Download
    AI Customize
    Side-by-side Pareto analysis blocks with 20% and 80% sections, representing complaints and reasons in contrasting colors.
    Add to Wishlist
    Download
    AI Customize
    Four rounded rectangles in purple, magenta, red, and blue with icons and three text boxes arranged horizontally.
    Add to Wishlist
    Download
    AI Customize
    Four colorful arrow shapes in yellow, blue, purple, and orange, each containing a letter and text below.
    Add to Wishlist
    Download
    AI Customize
    Capabilities analysis template featuring color coded categories on the left and a circular percentage chart on the right.
    Add to Wishlist
    Download
    AI Customize
    Circular diagram with four segments in yellow, green, blue, and teal, each containing icons around a white central circle.
    Add to Wishlist
    Download
    AI Customize
    Use Performance PowerPoint And Google Slides Template
    Add to Wishlist
    Download
    AI Customize
    Illustration of a woman analyzing colorful bar and pie charts, with three color coded circular icons on the right.
    Add to Wishlist
    Download
    AI Customize
    Five numbered interconnected puzzle pieces in red, green, purple, teal, and blue, with human illustrations above.
    Add to Wishlist
    Download
    AI Customize
    Analysis template with a man looking through a magnifying glass at a computer screen with four types and caption areas.
    Add to Wishlist
    Download
    AI Customize
    Step-by-step analysis diagram with a central focus on analysis, flanked by six green-highlighted steps.
    Add to Wishlist
    Download
    AI Customize
    Molecular-style infographic with interconnected colored nodes linked to six labeled captions for analysis ideas.
    Add to Wishlist
    Download
    AI Customize
    Central hexagonal shape with multicolor triangles around and two text areas with bar chart and coin stack with percentages.
    Add to Wishlist
    Download
    AI Customize
    Business Analytics slide featuring three stages with icons representing question, insight, and growth.
    Add to Wishlist
    Download
    AI Customize
    Illustration of a person analyzing charts in blue accents, with four analysis types listed on the right.
    Add to Wishlist
    Download
    AI Customize
    Four colorful vertical banners in yellow, red, blue, and green with icons, title, and descriptions for web analytics uses.