Best Analytics Presentation Template with Four Nodes

Analytics tactics slide with four numbered captions in orange, red, blue, and green, each paired with relevant icons.
P.ID : 7170
    1.4K+ views
    138 Downloads
    Get Custom Slides by Experts
    Instantly Access Templates in PowerPoint

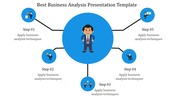
    Efficient Analytics PowerPoint Template: Four Nodes


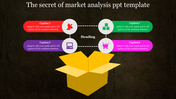
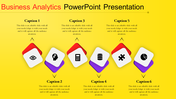
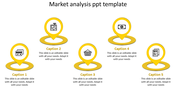
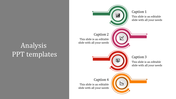
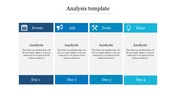
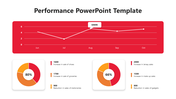
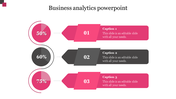
    Embark on a data-driven journey with our analytics presentation template. This dynamic slide has four icons, each accompanied by captions, titleholders, and text areas, all elegantly arranged against a crisp white background.

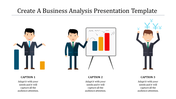
    Best for analysts, businesses, and professionals, this template is a visual marvel in analytics presentations. It seamlessly combines aesthetics with functionality, providing a comprehensive platform for data exploration and insights.

    Empower your presentations with the Analytics template. Elevate discussions, guide your audience through data intricacies, and showcase analytical prowess with clarity. Redefine the way you convey data insights—precision meets aesthetics in this powerful template. Your journey to impactful analytics presentations begins here.

    Features of the template


    • 100% customizable slides are easy to download.
    • Slides are available in different colors.
    • The slide has 4:3 and 16:9 formats.
    • It is easy to change the slide colors quickly.
    • It has a cute design to impress an audience.
    • Create feature-rich, animated presentations.
    Advertisement

    You May Also Like These PowerPoint Templates

    Add to Wishlist
    Download
    AI Customize
    Six pie analysis charts in blue, red, orange, green, teal, and purple, displaying percentages from 15% to 90%.
    Add to Wishlist
    Download
    AI Customize
    Linear timeline showing red triangular nodes connected by dots, each node containing an icon and caption.
    Add to Wishlist
    Download
    AI Customize
    Attractive Business Analytics PowerPoint Template Design
    Add to Wishlist
    Download
    AI Customize
    Business analysis slide with a central pink gradient circle surrounded by  six colorful icons with text, on a gray backdrop.
    Add to Wishlist
    Download
    AI Customize
    A person working on a laptop with analysis data, alongside bar charts with percentage and text box, on a gray background.
    Add to Wishlist
    Download
    AI Customize
    Colorful SOAR Model PowerPoint slide with circles and icons with strength, opportunities, aspirations, and results.
    Add to Wishlist
    Download
    AI Customize
    Analytics slide with line graph, pie chart, and statistics showing 13M views, 13M active subscribers, and 991K subscribers.
    Add to Wishlist
    Download
    AI Customize
    Financial slide with golden globes for two countries, featuring coin stacks next to one, with blue percentage bars below.
    Add to Wishlist
    Download
    AI Customize
    Performance PPT And Google Slides Themes For Your Needs
    Add to Wishlist
    Download
    AI Customize
    Market analysis PowerPoint slide featuring a pie chart with labeled segments and captions for each market category.
    Add to Wishlist
    Download
    AI Customize
    Analysis presentation slide showing a technology growth chart with percentage values and icons with placeholder text.
    Free
    Add to Wishlist
    Download
    AI Customize
    Best Scenario Analysis Presentation Template Slides
    Add to Wishlist
    Download
    AI Customize
    Financial analysis slide with a bold 40% statistic, a financial overview section, and a businessperson pointing.
    Add to Wishlist
    Download
    AI Customize
    Customize Feasibility Study PPT And Google Slides Themes
    Add to Wishlist
    Download
    AI Customize
    Analysis PPT slide with four colorful text boxes and unique icons for each stage of the process with captions.
    Add to Wishlist
    Download
    AI Customize
    Yellow pie chart divided into Analysis 1, 2, and 3 segments, focused by a black magnifying glass icon.