Amazing Analysis PowerPoint Presentation Template Design

 Canva
Canva
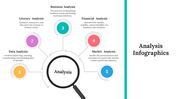


Tech Insight: Empowering Analysis Presentation Template!
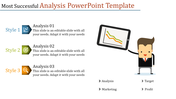
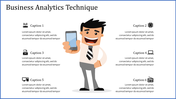
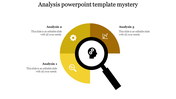
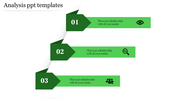
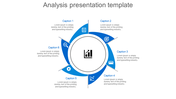
Unveil the future with our analysis presentation template! Dive into data-driven insights effortlessly with our engaging slides, each meticulously designed to showcase your findings dynamically. Picture this: a sleek, colorful interface adorned with intuitive technology icons, guiding your audience through a journey of discovery.
Tailored for professionals, students, and all seeking impactful presentations, our template is your go-to solution. Effortlessly analyze data, captivate, and leave an impression. Whether dissecting trends or presenting breakthroughs, elevate your message with flair. Transform analysis into an immersive experience. Download now, unlock seamless presentation power!
Features of the template
- 100% customizable slides and easy to download.
- Slides are available in different colors
- The slide has 4:3 and 16:9 formats.
- Easy to change the slide colors quickly.
- Appealing Presentation to impress an audience.
- Create feature-rich slide presentations.
- An eye-pleasing color slide helps to give a catchy display.
- Highly compatible with PowerPoint and Google Slides.


You May Also Like These PowerPoint Templates
Add to Wishlist
Download
Edit


Add to Wishlist
Download
Edit

Add to Wishlist
Download
Edit

Add to Wishlist
Download
Edit

Add to Wishlist
Download
Edit

Add to Wishlist
Download
Edit


Add to Wishlist
Download
Edit


Add to Wishlist
Download
Edit


Add to Wishlist
Download
Edit

Add to Wishlist
Download
Edit

Add to Wishlist
Download
Edit


Add to Wishlist
Download
Edit

Add to Wishlist
Download
Edit

