Black FridaySave Up to 50% on Lifetime plan

Editable Performance PowerPoint And Google Slides Template

Nodes

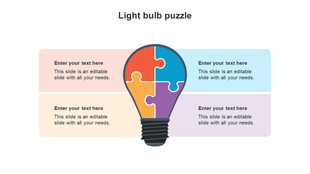
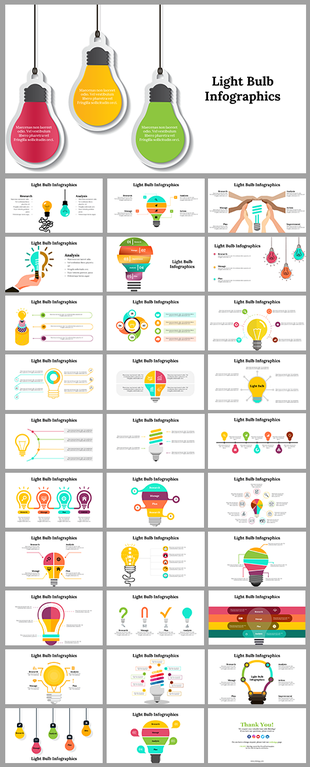
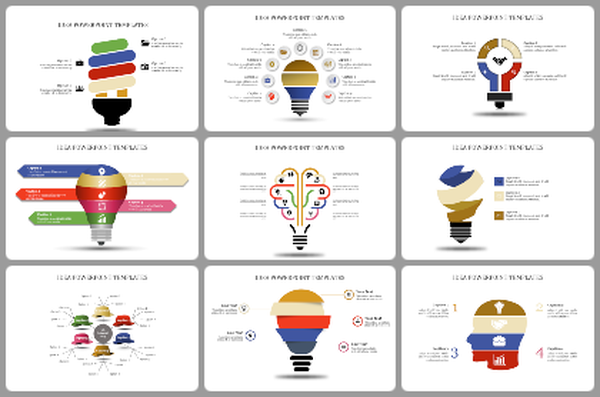
Performance PPT slide with a colorful lightbulb illustration representing optimal performance and five key management areas.

Colors

    P.ID : 44121
    13 slides
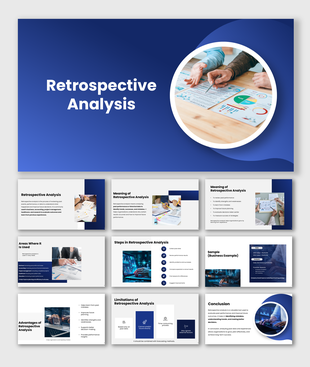
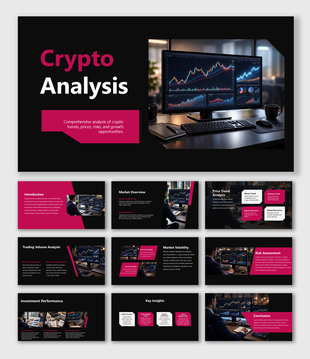
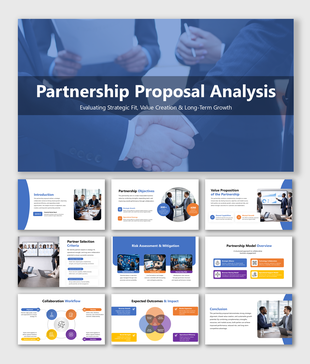
    Slide deck featuring multiple analysis templates with colorful layouts, charts, and icons for data representation.
    13 slides
    Pack of slides with colorful icons and sections for various data analysis, including visuals and layouts.
    13 slides
    Analysis PowerPoint Presentation And Google Slides Themes
    16 slides
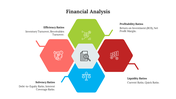
    Slide deck with hexagonal and arrow shaped diagrams in various colors, presenting financial analysis concepts.
    18 slides
    Real estate market analysis presentation slides with skyline visuals, trends, segments and growth insights set.
    13 slides
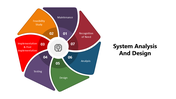
    System Analysis And Design slides with cycle charts, colorful shapes, text holders, Customer Order Cycle.
    13 slides
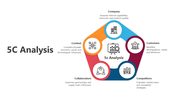
    5C analysis slide deck with various colorful layouts explaining the company, customers, competitors, collaborators, context.
    11 slides
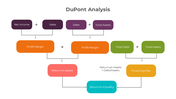
    Dupont analysis overview slides illustrating the calculation of profit margin with different layout designs with icons.
    18 slides
    Marketplace analysis presentation slides with market trends, segments growth insights and rival data overview.
    11 slides
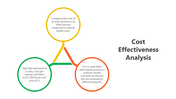
    Slide deck showcasing cost effectiveness analysis with a triangular infographic and colorful supporting charts.
    13 slides
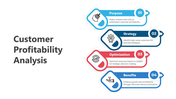
    Infographic detailing key phases of customer profitability analysis slide deck with icons and color-coded segments.
    20 slides
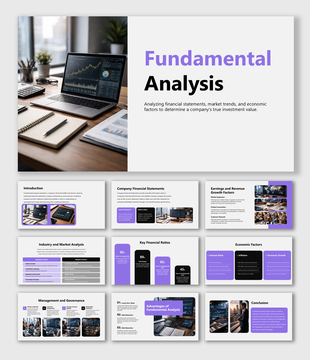
    Fundamental analysis evaluates financial data, industry trends, and economic factors to determine a company’s true value.
    11 slides
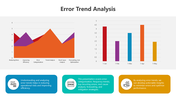
    Error Trend Analysis charts showing error categories, frequency trends, root causes, recurring errors, and insights.
    12 slides
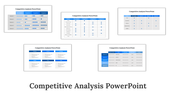
    Competitive analysis slides featuring various comparison tables and rating charts for evaluating competitors.
    13 slides
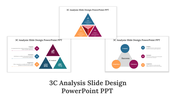
    3C analysis slides with various triangle shaped layouts in vibrant colors representing company, customers, and competitors.
    904 Views
    169 Downloads
    Santhiya K Designer
    Get Custom Slides by Experts
    Enhance Your Presentations with Add-ins

    Tags

    • Analysis
    • Light Bulb
    • Google Slides
    Advertisement

    Performance PowerPoint Template 

    If you want to present your company’s performance in front of a tough audience—this document will definitely come in handy. Consistency in performance is like holding a puppy. It seems so easy until you realize the puppy is on fire. Our Performance PPT Template features a colorful layout that is sure to impress. The overall chart is drawn with a blue arrow on the left side. It indicates that this step involves using lessons learned from previous reviews to make modifications and set new goals for the coming period. Don’t miss out on presenting your performance to the board of directors and stakeholders!

    Features of the template:

    • 100% customizable slides and easy to download.
    • Slides are available in different nodes & colors.
    • The slide contained 16:9 and 4:3 formats.
    • Easy to change the slide colors quickly.
    • Well-crafted template with an instant download facility.
    • Three nodes in arrow.

    More Collections for Editable Performance PowerPoint

    Recommended based on this template.

    Similar Templates to Editable Performance PowerPoint
    Free
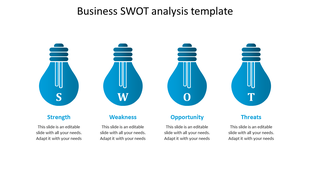
    Business SWOT analysis template with blue light bulb icons representing strengths, weaknesses, opportunities, and threats.
    Free
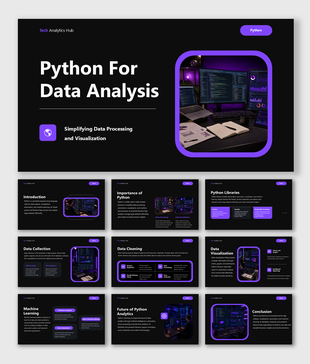
    Python for data analysis presentation covering visualization, machine learning, analytics, and coding tools in business.

    Showing20 of69,218 templates