Five Noded Analytics PowerPoint Template Slide

Purple analytics PowerPoint template with sequentially numbered arrows, each with a different icon for key business metrics.
P.ID : 6099
    2.5K+ views
    159 Downloads
    Get Custom Slides by Experts
    Instantly Access Templates in PowerPoint

    Analytics PowerPoint Template


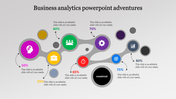
    Introducing our analytics PowerPoint template, your key to presenting data-driven insights with clarity and impact. This template is crafted for professionals seeking to communicate complex analytics findings in a visually compelling way. With sleek and customizable slides, it transforms raw data into clear visualizations, making statistical information accessible to a broad audience. Whether you're analyzing trends, presenting key metrics, or sharing data-driven recommendations, this template ensures a professional and engaging presentation. 


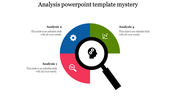
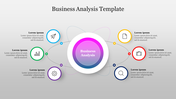
    Featuring five nodes in a distinct purple color set against a clean white background, this template ensures that your thoughts are clearly conveyed to your audience. Elevate your analytics discussions, impress your audience, and effectively convey the story behind the numbers with our thoughtfully designed analytics PowerPoint template. Download now to add a touch of sophistication and clarity to your analytical presentations.


    Features of the template

    • 100% customizable slides and easy to download.
    • Slides are available in different nodes & colors.
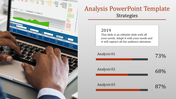
    • The slide contains 16:9 and 4:3 formats.
    • It is easy to change the colors of the slide quickly.
    • Well-crafted template with an instant download facility.

    Advertisement

    You May Also Like These PowerPoint Templates

    Add to Wishlist
    Download
    AI Customize
    Colorful SOAR Model PowerPoint slide with circles and icons with strength, opportunities, aspirations, and results.
    Add to Wishlist
    Download
    AI Customize
    Analytics slide with line graph, pie chart, and statistics showing 13M views, 13M active subscribers, and 991K subscribers.
    Add to Wishlist
    Download
    AI Customize
    Financial slide with golden globes for two countries, featuring coin stacks next to one, with blue percentage bars below.
    Add to Wishlist
    Download
    AI Customize
    Performance PPT And Google Slides Themes For Your Needs
    Add to Wishlist
    Download
    AI Customize
    Market analysis PowerPoint slide featuring a pie chart with labeled segments and captions for each market category.
    Add to Wishlist
    Download
    AI Customize
    Analysis presentation slide showing a technology growth chart with percentage values and icons with placeholder text.
    Free
    Add to Wishlist
    Download
    AI Customize
    Best Scenario Analysis Presentation Template Slides
    Add to Wishlist
    Download
    AI Customize
    Financial analysis slide with a bold 40% statistic, a financial overview section, and a businessperson pointing.
    Add to Wishlist
    Download
    AI Customize
    Customize Feasibility Study PPT And Google Slides Themes
    Add to Wishlist
    Download
    AI Customize
    Analysis PPT slide with four colorful text boxes and unique icons for each stage of the process with captions.
    Add to Wishlist
    Download
    AI Customize
    Yellow pie chart divided into Analysis 1, 2, and 3 segments, focused by a black magnifying glass icon.
    Add to Wishlist
    Download
    AI Customize
    Graph with three numbered curves in green, orange, and red, with corresponding text on the right.
    Add to Wishlist
    Download
    AI Customize
    Slide showing financial data with a smiling cartoon businessman and two green-highlighted doughnut graphs.
    Free
    Add to Wishlist
    Download
    AI Customize
    Blue themed slide with two square icons on tilted diamonds and two rectangular caption boxes on the right.
    Free
    Add to Wishlist
    Download
    AI Customize
    Analysis PPT slide showing a phone with a checklist and icons with multiple captions with text descriptions.
    Free
    Add to Wishlist
    Download
    AI Customize
    Circular analysis diagram featuring six purple sections with icons like a target and gear, arranged around a black bar chart.
    Free
    Add to Wishlist
    Download
    AI Customize
    Four triangular icons in yellow, pink, purple, and red, showing percentages, with gray caption boxes below.
    Add to Wishlist
    Download
    AI Customize
    Slide featuring a five step process for performance with matching icons for each phase.
    Free
    Add to Wishlist
    Download
    AI Customize
    Analysis presentation template with six sections arranged in a yellow circle, each featuring an icon and caption.