Creative Business Analytics PowerPoint For Presentation

Creative Business Analytics PowerPoint For Presentation
P.ID : 38528
    178 views
    26 Downloads
    Get Custom Slides by Experts
    Instantly Access Templates in PowerPoint

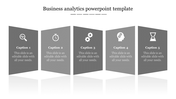
    Modern Business Analytics PowerPoint

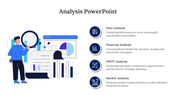
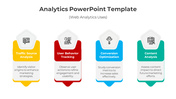
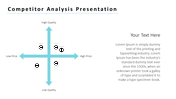
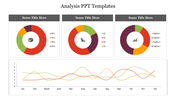
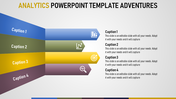
    The technique of gathering, analyzing, and solving data for use in company decisions and methods is known as business analytics. Data is gathered from various sources, examined for patterns and trends, and then used to provide insights and guide decision-making. Three vibrant arrows in this template are pointing in opposing foci. The arrows depict the idea of building models and assessing the data using multiple techniques to produce a thriving result. This template is ideal for visually appealing displays of analytics concepts and ideas.

    Features of the template

    • 100% customizable slides and easy to download.
    • Slides are available in different colors
    • The slide has 4:3 and 16:9 formats.
    • Easy to change the slide colors quickly.
    • Appealing Presentation to impress an audience.
    • Create feature-rich slide presentations. 
    • An eye-pleasing color slide helps to give a catchy display.
    • It is adept with PPT and Google Slides.
    Advertisement

    You May Also Like These PowerPoint Templates

    Add to Wishlist
    Download
    AI Customize
    Central speedometer icon with curved black line and five connected colored circles linking labeled sections.
    Add to Wishlist
    Download
    AI Customize
    Four hexagons in red, blue, yellow, and green, each with a relevant financial icon and captions around it.
    Add to Wishlist
    Download
    AI Customize
    Three segmented semi circular diagram in blue tones with icons, and a black magnifying glass overlaying a head symbol.
    Free
    Add to Wishlist
    Download
    AI Customize
    Vertical bar chart with five captions and a magnifying glass highlighting one, and numbered list with text on the right.
    Free
    Add to Wishlist
    Download
    AI Customize
    Business slide with two numbered green markers, a magnifying glass over coins, and a group of people analyzing a chart.
    Add to Wishlist
    Download
    AI Customize
    Pricing table layout with three columns labeled with subscription, in a red and white color scheme.
    Add to Wishlist
    Download
    AI Customize
    Slide featuring four circular progress charts in yellow, pink, blue, and green, with captions on a gray background.
    Add to Wishlist
    Download
    AI Customize
    Analysis PowerPoint template featuring four colorful stages from data interpretation to risk Assessment with icons.
    Add to Wishlist
    Download
    AI Customize
    Three head silhouettes in blue and gray with icons, connected by arrows with captions below, on a white background.
    Add to Wishlist
    Download
    AI Customize
    Analysis PowerPoint template displaying a blue circular diagram with steps from interviewing stakeholders to building BPMN.
    Add to Wishlist
    Download
    AI Customize
    Analysis report template featuring a purple and green area graph comparing five projects, with separate information
    Add to Wishlist
    Download
    AI Customize
    Six oval elements in gray with icons and labels for analysis categories placed in white backdrop.
    Add to Wishlist
    Download
    AI Customize
    Modern design featuring a circular orange arc in the center, flanked by six numbered steps on curved paths on both sides.
    Add to Wishlist
    Download
    AI Customize
    Three vertical blocks in yellow, blue, and green, each with numbers and business analytics icons on a light background.
    Add to Wishlist
    Download
    AI Customize
    A pack of DESC model slides with four elements in various colorful layout designs with text descriptions.
    Add to Wishlist
    Download
    AI Customize
    Circular flowchart with colored arrows in blue, purple, orange, and yellow, pointing to icons and text areas beneath.
    Add to Wishlist
    Download
    AI Customize
    A PowerPoint slide featuring a magnifying glass focusing on data analysis with icons representing various analytics metrics.