MILESTONE 🌟 5 Million+ creative minds trust SlideEgg! Grab 80% OFF

Innovate Analysis Powerpoint And Google Slides Template

Data analysis featuring icons for data interpretation, market research, and performance evaluation.
P.ID : 2845
    1.1K+ views
    173 Downloads
    Get Custom Slides by Experts
    Instantly Access Templates in PowerPoint

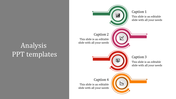
    Best Analysis PowerPoint Template 


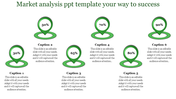
    Analysis involves examining data or information to uncover patterns, insights, or trends. It's used by professionals across fields like data analysis, research, finance, business management, and science. They use it to understand complex datasets, identify opportunities, solve problems, and make informed decisions. Analysis typically involves tools like statistical software, data visualization tools, spreadsheets, and algorithms. Visual representations such as charts, graphs, and tables help summarize findings. Templates for analysis streamline the process, ensuring consistency and facilitating communication of insights. These analysis template may include frameworks or methodologies tailored to specific types of analysis, like financial analysis or market research. The goal is to present insights clearly and effectively to stakeholders.

    Features of this template


      • 100% customizable slides and easy to download.
      • The slide contains 16:9 and 4:3 formats.
      • Easy to change the colors of the slide quickly.
      • Highly compatible with PowerPoint and Google Slides.
      Advertisement

      You May Also Like These PowerPoint Templates

      Add to Wishlist
      Download
      AI Customize
      Financial analysis slide with icons of coins, hand with cash, transaction, and refund on clipped sheets.
      Add to Wishlist
      Download
      AI Customize
      Easily Usable Performance PPT And Google Slides Template
      Add to Wishlist
      Download
      AI Customize
      Creative Business Analytics PowerPoint For Presentation
      Add to Wishlist
      Download
      AI Customize
      Six pie analysis charts in blue, red, orange, green, teal, and purple, displaying percentages from 15% to 90%.
      Add to Wishlist
      Download
      AI Customize
      A colorful risk analysis matrix slide chart, displaying low, medium, high, and extreme risk levels in a grid format.
      Add to Wishlist
      Download
      AI Customize
      Linear timeline showing red triangular nodes connected by dots, each node containing an icon and caption.
      Add to Wishlist
      Download
      AI Customize
      Attractive Business Analytics PowerPoint Template Design
      Add to Wishlist
      Download
      AI Customize
      Business analysis slide with a central pink gradient circle surrounded by  six colorful icons with text, on a gray backdrop.
      Add to Wishlist
      Download
      AI Customize
      A person working on a laptop with analysis data, alongside bar charts with percentage and text box, on a gray background.
      Add to Wishlist
      Download
      AI Customize
      Colorful SOAR Model PowerPoint slide with circles and icons with strength, opportunities, aspirations, and results.
      Add to Wishlist
      Download
      AI Customize
      Analytics slide with line graph, pie chart, and statistics showing 13M views, 13M active subscribers, and 991K subscribers.
      Add to Wishlist
      Download
      AI Customize
      Performance PPT And Google Slides Themes For Your Needs
      Add to Wishlist
      Download
      AI Customize
      Market analysis PowerPoint slide featuring a pie chart with labeled segments and captions for each market category.
      Add to Wishlist
      Download
      AI Customize
      Analysis presentation slide showing a technology growth chart with percentage values and icons with placeholder text.
      Free
      Add to Wishlist
      Download
      AI Customize
      Best Scenario Analysis Presentation Template Slides